

Why I’m writing this now
I’ve been putting off writing this one for a while.
A few months ago, while roaming around Reddit, I posted a fairly aggressive thesis about what another major Texas winter event could look like. It became my most-read post on the platform.
It also, reasonably, drew plenty of skepticism.
At the time, El Niño was still mostly a developing forecast. The signal was there, but there was still enough uncertainty around its strength and persistence that I felt more comfortable watching it than writing around it.
That has changed.
As we move into Q4, El Niño is no longer just something sitting in seasonal forecast models. The event is developing, the signal is becoming more established, and the upcoming Texas winter is starting to become worth tracking in real time.

This article is not an attempt to manufacture a doomsday narrative.
I am not trying to predict another February 2021 months in advance, and El Niño by itself cannot tell you whether Texas will experience a major freeze.
What it can do is change the atmospheric backdrop.
And once that backdrop starts shifting, the more useful question becomes:
What kind of ERCOT grid would that weather be interacting with?
Because the grid entering the winter of 2026 is materially different from the one that entered Winter Storm Uri.
More solar.
More wind.
Far more battery storage.
Higher demand.
A different net-load profile.
And a market that can still compress a disproportionate amount of economic stress into a very small number of hours.
A few bad days can define an entire year
Power markets have a strange relationship with time.
There are 8,760 hours in a year, but economically, they are nowhere near equal.
Most can pass without much excitement. Supply meets demand, prices behave, and the grid does what it is supposed to do. Then you get a handful of hours where weather, demand and generation availability begin moving against each other.
Those hours can change the economics of an entire year.
Winter Storm Fern gave us a recent example of just how concentrated that exposure can become.
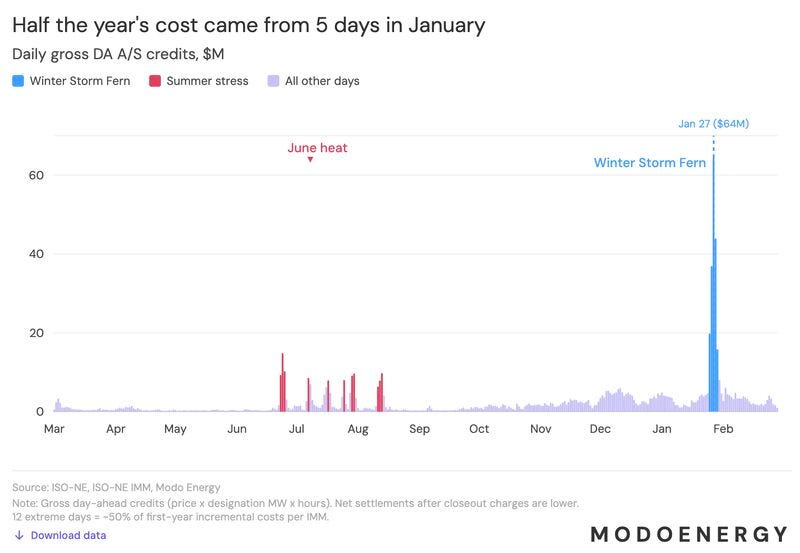
What interests me about this chart is not simply the size of the January spike.
It is everything around it.
For most of the year, the market shown here looks relatively uneventful. You can see periods of summer stress, particularly through June, July and August, but nothing remotely comparable to the concentration that develops around Winter Storm Fern.
Five days changed the picture.
That is the nature of tail risk in electricity markets. You do not need 365 days of grid stress to produce an expensive year. You need the wrong conditions to overlap for long enough.
And Texas is becoming an increasingly interesting place to think about that overlap.
Since 2020, ERCOT has added enormous amounts of wind, solar and, more recently, battery storage to its generation stack. These resources have given the grid access to huge volumes of low-marginal-cost electricity when conditions cooperate.
But they have also changed when electricity is abundant.
Solar can push daytime prices down while leaving the grid with a steep transition as generation disappears into the evening. Wind can produce tens of gigawatts one day and substantially less under a different weather pattern. Batteries can move electricity across time, but only for as long as their stored energy lasts.
None of those characteristics are inherently a problem.
They do, however, make timing increasingly important.
And on September 2, ERCOT gave us a fairly clean example of what that looks like.
What happened on September 2
September 2 gave us a fairly clean example of the market dynamic I have been watching.
For most of the day, ERCOT had a massive amount of renewable generation available. Wind and solar climbed toward 40 GW during the late morning, supplying a substantial portion of total system demand.
Even by 6:05 p.m., renewable generation was still sitting at roughly 27.2 GW, supplying 31.5% of ERCOT demand.
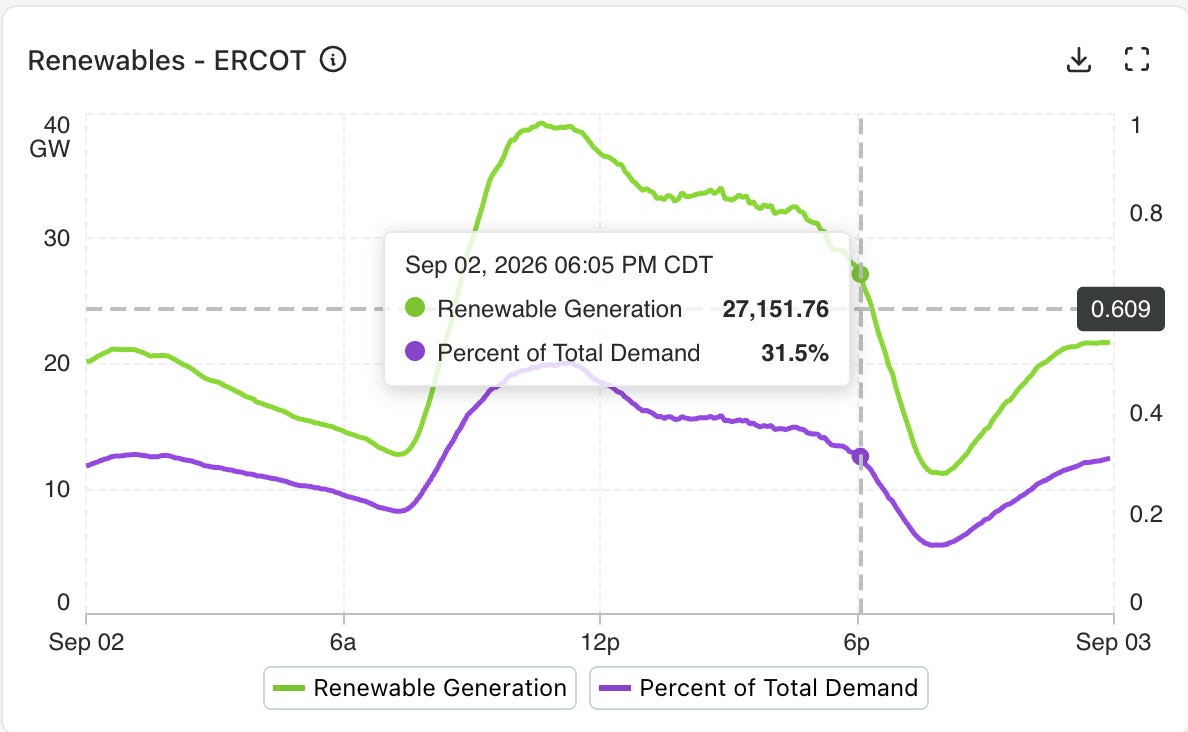
But look at what happens immediately after 6 p.m.
Renewable output begins falling sharply.
A large part of that is intuitive. The sun is setting, solar production is rolling off, but Texans have not suddenly stopped consuming electricity. The grid now has to replace that disappearing generation with resources elsewhere in the stack.
This is the ramp.
And it is where the economics start getting interesting.
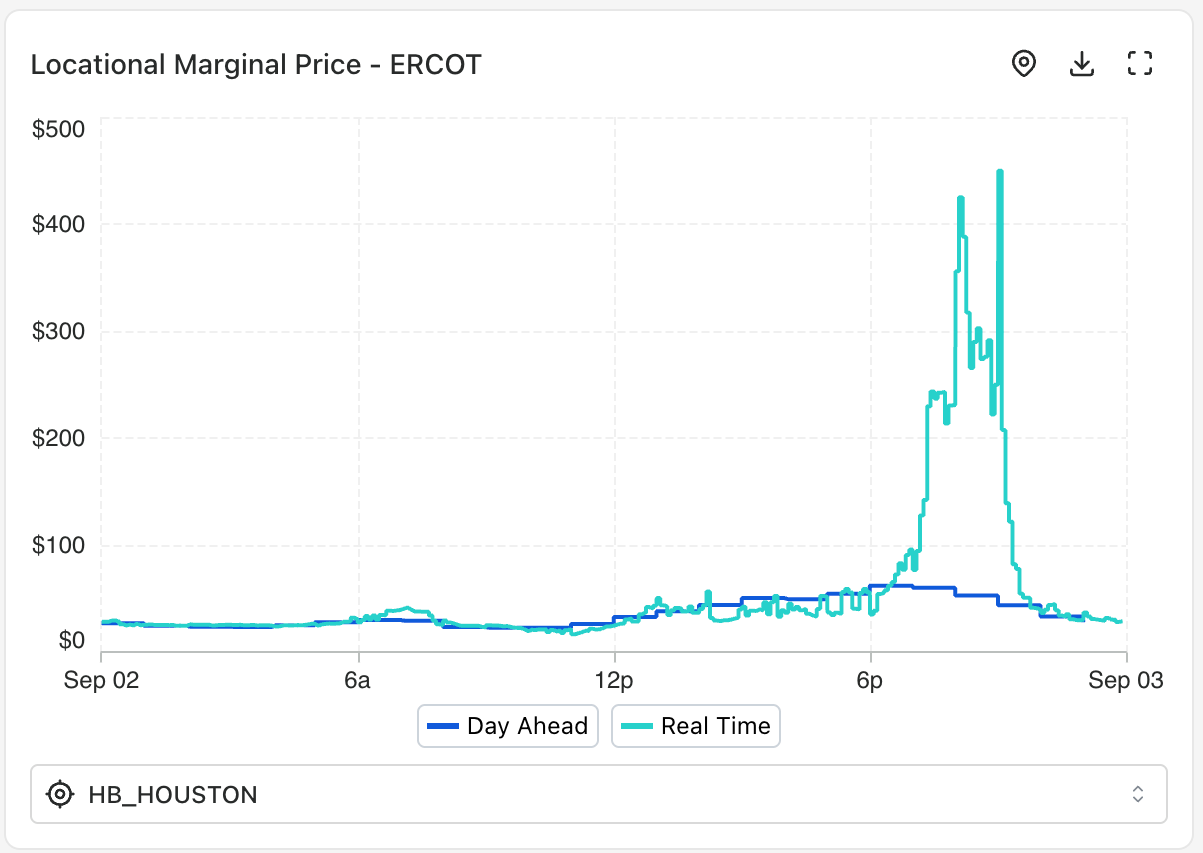
For most of September 2, Houston’s real-time price followed a relatively uneventful path.
Then the evening arrived.
As renewable output declined, real-time LMPs began separating aggressively from the day-ahead curve. Prices moved through $100/MWh, then $200, then $300, before briefly touching roughly $450/MWh later that evening.
Battery storage was responding at the same time.
ERCOT batteries reached roughly 12.6 GW of discharge around 7:30 p.m., helping bridge the transition away from daytime generation. Yet the largest Houston price spike shown above arrived later, around 9 p.m., after that battery discharge peak.
That sequence is more interesting to me than the $450 price itself.
Texas had not suddenly run out of generation.
A few hours earlier, the grid had been swimming in low-marginal-cost electricity.
The problem was when that electricity was available relative to when it was needed.
This is one of the dynamics that has become increasingly important as ERCOT’s generation mix has changed.
Renewables can suppress the price curve during periods of strong production while simultaneously increasing the amount of generation that must be replaced when that production rolls off. Batteries can absorb some of that timing mismatch by charging during periods of abundance and discharging when the system tightens.
But batteries introduce a constraint of their own.
They store energy. They do not create it.
So the question is not simply how many megawatts of battery capacity ERCOT has installed. It is how much energy remains stored, how quickly that energy is being discharged, how long the underlying system stress lasts, and what generation is available once those batteries begin running down.
That distinction becomes much more important when we stop talking about an ordinary September evening and start talking about weather events lasting hours or days.
And that is where El Niño enters this story.
So, what exactly is El Niño?
Before getting into what is developing for this winter, it helps to understand what El Niño actually is.
The process begins thousands of miles away from Texas, across the tropical Pacific Ocean.
Under normal conditions, trade winds push warm surface water westward toward Asia and Australia. During El Niño, those winds weaken and unusually warm water expands eastward across the central and eastern equatorial Pacific.
On its own, warmer water in the Pacific does not sound particularly relevant to the Texas power grid.
The atmosphere is what makes it relevant.
Warmer Pacific waters shift where tropical thunderstorms and rising air concentrate. That disturbance works its way into the broader atmospheric circulation and changes the position and strength of the jet streams moving across North America.
Think of the jet stream as a highway for weather.
Move the highway, and you begin changing where storms travel, where moisture concentrates, and which parts of the country are more likely to experience warmer, colder, wetter or drier conditions.
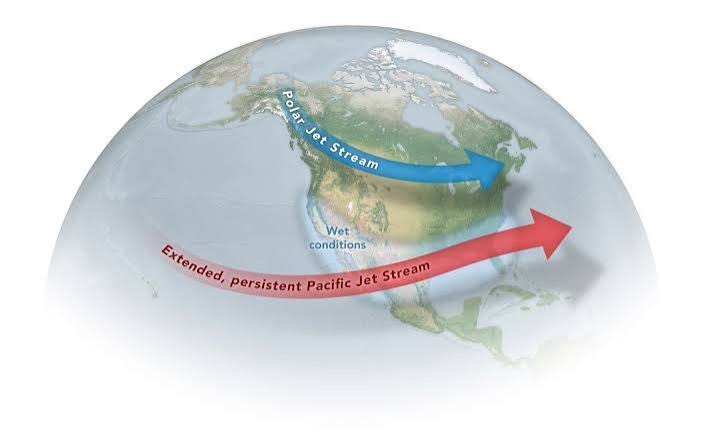
During a typical El Niño winter, the Pacific jet tends to extend farther east and shift southward across the United States. That pushes more storm activity across the southern portion of the country. Historically, the result has been an increased tendency toward cooler and wetter winter conditions across the southern tier, including Texas and the Gulf Coast. NOAA identifies wetter-than-average Gulf Coast conditions from Texas to Florida as one of the more consistent U.S. El Niño signals.
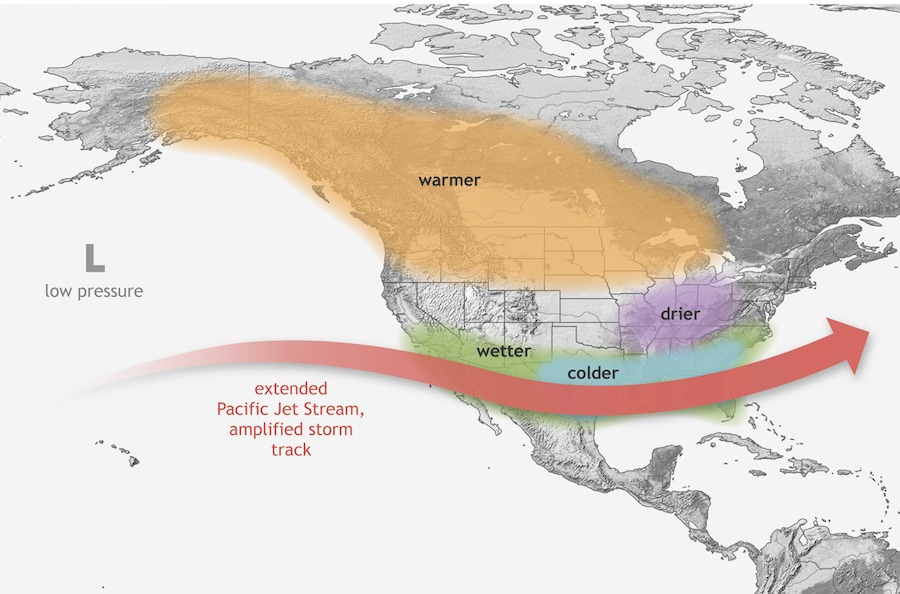
But typical is the important word here.
This map is not a forecast for Texas.
El Niño does not mean an Arctic outbreak is coming. It does not mean Texas will freeze. And it certainly does not mean another Winter Storm Uri is predetermined.
In fact, El Niño winters do not inherently favor more Arctic outbreaks across the southern United States. The stronger subtropical jet more consistently favors storminess, cloud cover and precipitation.
What El Niño gives us is something different.
It gives us a shift in probabilities.
Every El Niño develops alongside other atmospheric patterns, and every event interacts with the jet stream differently. NOAA’s own historical analysis makes this distinction clear: the recurring patterns associated with El Niño happen more often than chance would suggest, but they do not occur during every event.
That distinction is important for everything that follows in this series.
I am not tracking El Niño because it tells us what the weather will be on a particular January morning.
I am tracking it because it changes the background conditions from which that weather will eventually emerge.
And this year, those background conditions are becoming difficult to ignore.
This El Niño is starting to look different
What makes this worth tracking now is how quickly the outlook has changed.
Back in March, NOAA gave El Niño a 62% chance of emerging by June through August, with its eventual strength still highly uncertain. By May, the probability of formation had climbed to 82%, with a 96% chance that El Niño would persist through the coming winter.
Now we are here.
As of NOAA’s August update, El Niño is strengthening, with a greater than 90% chance of becoming a very strong event through fall and winter 2026–27.
More interestingly, NOAA currently assigns a 69% chance that the October through December period reaches a strength exceeding previous El Niño events in its record dating back to 1950.
That is a significant progression from where we started this year.
But strength still does not equal impact.
A record-strength El Niño would not automatically produce a record Texas winter. What it does is increase the probability that the atmospheric patterns associated with El Niño become more pronounced. NOAA itself makes that distinction.
And that is really where my interest begins.
We have a potentially historic weather pattern developing at the same time Texas is operating with more weather-dependent generation, more battery storage, higher demand, and a completely different intraday generation profile than it had five years ago.
The question is what happens when those two systems meet.
What I’m watching from here
So where does this leave Texas?
Not with a prediction of another Uri.
What we have instead is a strengthening El Niño entering the same winter in which ERCOT is operating with more renewable generation, more battery storage, and a generation profile increasingly shaped by when those resources are available.
NOAA now gives this El Niño a greater than 90% chance of becoming very strong through fall and winter. There is also a 69% chance that its October through December strength exceeds previous El Niño events in the record dating back to 1950. But even NOAA is explicit about the distinction: a stronger El Niño increases the chances of its typical impacts. It does not guarantee them.
That is why I want to track this as it develops rather than pretend we already know the outcome.
From here, I am watching the Texas temperature outlook, the evolution of the jet stream, renewable availability, ERCOT’s evening ramps, battery behavior, thermal availability and, eventually, the first meaningful cold fronts that test the system.
September 2 showed how quickly the economics can change when generation availability shifts over a matter of hours.
Winter gives that same relationship a much larger canvas.
The question is not whether El Niño creates another Uri.
It is what happens if an increasingly consequential weather pattern eventually meets the wrong combination of Texas demand, renewable availability and grid conditions at the same time.
Phase 1 is simply recognizing that the setup is now worth watching.
Read more from us
ERCOT October 2026 Outlook: Texas Grid Risk, Batteries, Data Centers and What to Watch

Access the ERCOT report: Monthly Outlook for Resource Adequacy (MORA)

