
How ERCOT Prices Electricity — A Plain Language Guide
Price spikes on the Texas grid are not malfunctions. Here is how the market is built, and why that distinction costs business owners thousands.

Summary
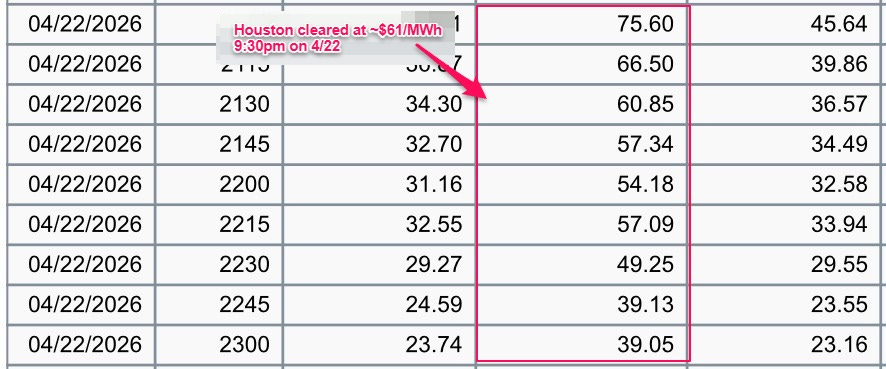
On April 27, 2026, the Houston wholesale market cleared at $748 per megawatt-hour. The same hour five days earlier cost $61.
ERCOT’s energy-only market is engineered to price at the extreme, not the average, which means small shifts in supply and demand during constrained periods produce outsized price swings by design.
What you walk away knowing in today’s article is how that risk travels from market dynamics and directly into your invoice, and why how you position in this market can save any business thousands in energy cost.
In This Issue
Section 01 — Laying The Groundwork
Section 02 — A Tale of Five
Section 03 — Why Renewables Don’t Lower Your Bill During a Spike
Section 04 — The Settlement Point Between the Wholesale Market and Your Meter
Section 05 — Summer Is When the Margin Gets Expensive
Section 06 — What Knowing This Changes
If you’re new here, start with these:
The Bill Is Coming: Why Texas Business Owners Can No Longer Ignore the Power Market
Understanding 4CP: Why Texas Electricity Prices Spike Every Summer
Section 01
Laying The Groundwork
To help visually illuminate on the concepts which will be discussed throughout the publication, let’s take a look into an actual five day span on settlement point prices in April 2026.
On April 27, 2026, the Houston wholesale market cleared at $748 per megawatt-hour at 9:30 PM. Five days earlier, at the same hour, it cleared at $61.
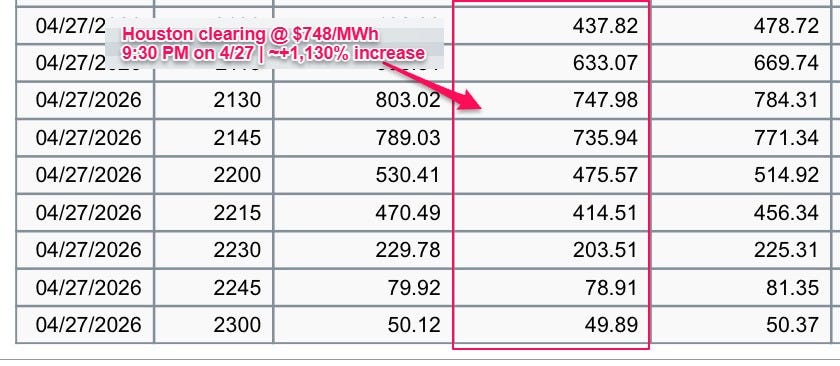
Remember, it’s very important to realize that this is not a market malfunction. This is simply a market working exactly as it was designed. You can find ERCOTs real time SPPs here.
Now that we have some actual examples of real-time price volatility let’s proceed to understanding just how and why this happens.
Section 02
A Tale of Five
Those two data points are not outliers pulled from different seasons or different stress events. They are the same market, the same hour, only five days apart in April. That gap is the volatility envelope in action.
Now the examples are only within a five day time span, but what do you see when looking a data spanning multiple years?
Analyzing historical average DAM pricing data from 2023 to 2026, here’s what we can confidently say:
 summer seasonality chart comparing monthly average DAM prices and maximum price spikes across June–September of 2023, 2024, and 2025, showing that extreme summer price spikes significantly exceed average market prices, particularly during scarcity conditions.")
Two things are true about this market simultaneously. The market is both stable and increasingly more volatile. When conditions tighten, the numbers do not “drift” upward. They move in orders of magnitude.
August 2023 averaged $265 for the entire month, with a single day breaching $1,081.
January 2026 averaged $67.50, roughly double a typical winter month, with a single-day spike to $574.
The 2024 summer is also worth noting. Averages stayed between $23 and $35 through July and August. No dramatic spikes.
That relative calm is real price action. But it was the product of favorable conditions: milder weather, adequate reserves, winds cooperating during peak hours. The market rewarded that luck. It does not guarantee it moving forward. When conditions become unfavorable you get months like August 2023.
What the full dataset shows is not that prices are always high. It is that when the conditions for a spike exist, the pricing response is non-linear. Small increases in demand during constrained periods do not produce small increases in price.
Again, this is not a flaw in the design. It is the design itself.
Section 03
Why Renewables Don’t Lower Your Bill During a Spike
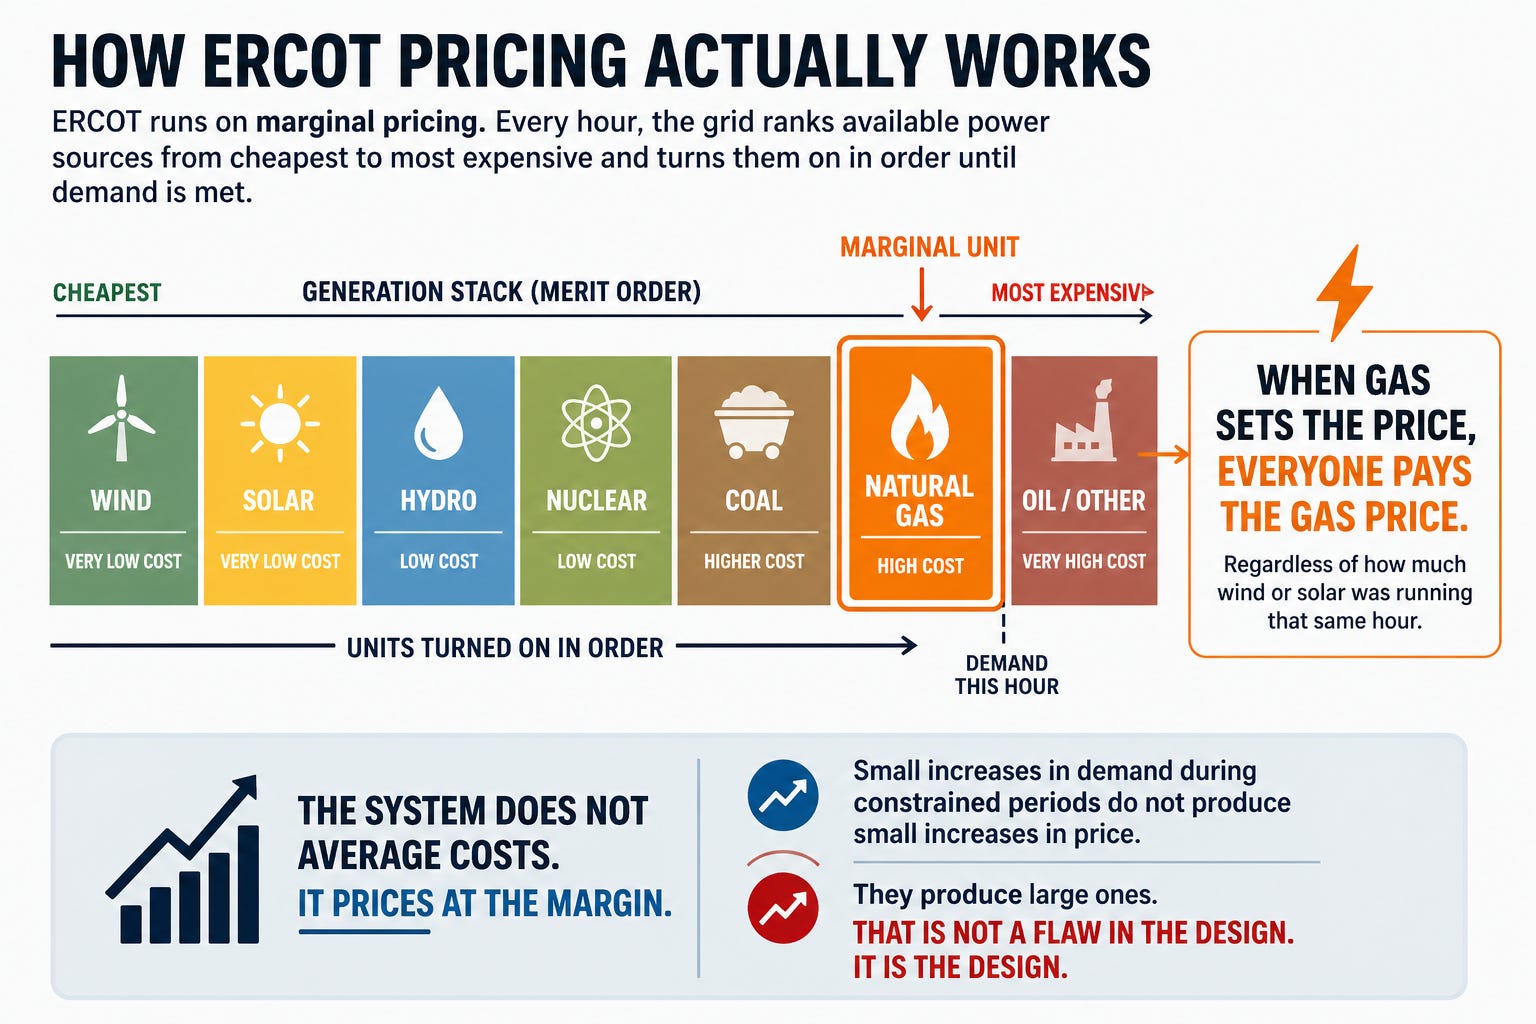
Texas runs more wind and solar than any other state in the country. On a good spring afternoon, renewables can cover more than half of total ERCOT demand. That fact leads most people to a reasonable but wrong conclusion: more renewable generation means lower prices.
It does, most of the time. The problem is the hours that are not “most of the time”.

ERCOT’s pricing mechanism does not care how much cheap generation ran earlier in the day. It cares about the most expensive unit of generation required to meet demand right now. By 8 PM on a hot August evening, solar output is near zero.
Wind in Texas tends to slow during the hottest parts of summer. What remains to meet a grid still carrying heavy cooling load is dispatchable thermal generation: natural gas peakers with high marginal costs. Those units set the price. Every other generator on the grid, including the wind farm that ran at near-zero cost all afternoon, gets paid that same clearing price.
This is the mechanic the merit order graphic makes visible. The grid ranks every available power source from cheapest to most expensive and dispatches them in order until demand is met.
The last unit turned on to satisfy demand sets the price for everyone. Wind and solar sit at the far left of that stack. Gas peakers sit at the far right.
When demand is low, the market never reaches the right side of the stack. When demand is high and cheaper sources are unavailable, the market has to reach those peakers, and the price resets to whatever it costs to run them.
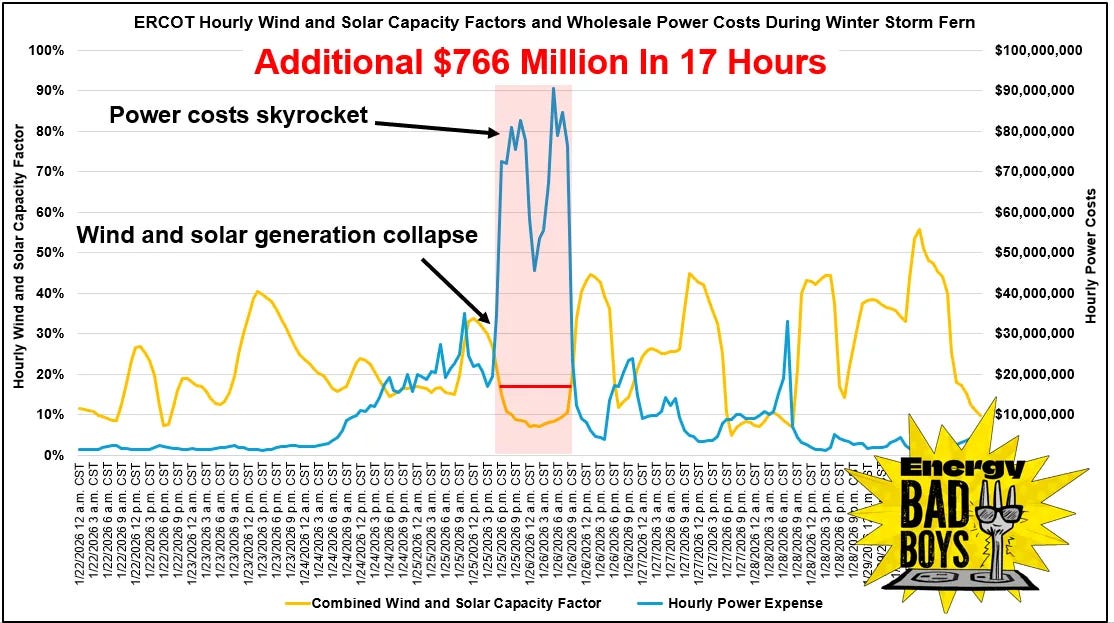
Here, Energy Bad Boys highlights how lower renewable output during Winter Storm Fern coincided with a sharp increase in wholesale power costs, demonstrating how supply shortfalls can amplify price volatility during periods of elevated demand.
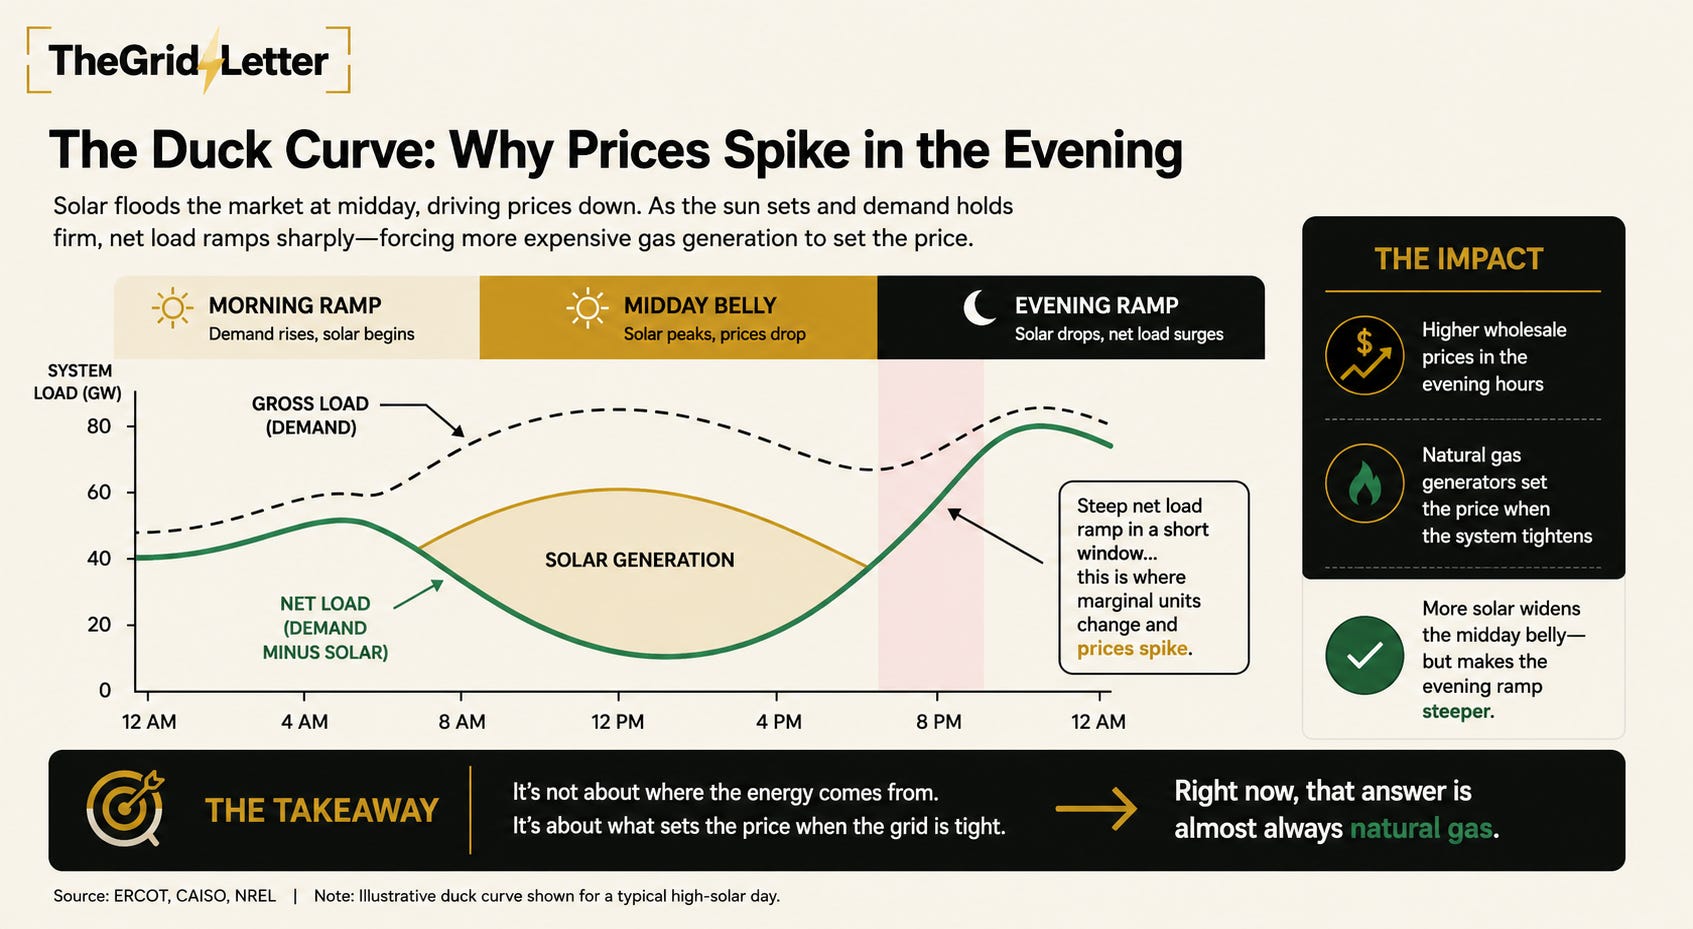
The energy industry calls this transition the duck curve.
Solar generation creates a wide belly of low-cost midday supply, then drops sharply into the evening hours just as residential and commercial cooling loads remain elevated.
The net load (the demand that dispatchable generators must cover) ramps steeply upward in a short window. That ramp is where the marginal unit changes. That is where your risk exposure lives.
The renewable buildout in Texas has made the belly of the duck wider and cheaper. It has also made the evening ramp steeper, because more of the daytime load is now covered by generation that cannot follow the sun past sunset.
Businesses that understand this frame make different decisions than businesses that do not. The question is not whether your electricity comes from renewables. The question is what is setting your price during the hours when the grid is tight. Right now, that answer is almost always natural gas. And natural gas peakers do not get cheaper as the grid adds more solar.
Section 04
The Settlement Point Between the Wholesale Market and Your Meter
The wholesale market prices electricity at thousands of individual electrical nodes across the grid, every five minutes.
Each node has a Locational Marginal Price, called an LMP that reflects the marginal cost of serving one additional megawatt of demand at that exact location, including the cost of energy, the cost of transmission congestion, and line losses.
During a stress event, LMPs at different nodes can diverge significantly depending on where the grid is congested and which generators are available locally.
Your business does not transact at a node. Almost no commercial customer does.
What your bill settles against is a Settlement Point Price. An SPP is a simplified financial price derived from groups of LMPs, depending on the type of settlement point: a hub, a load zone, or a specific node.
The Houston Hub (HB_HOUSTON) is the settlement point most relevant to commercial customers in the greater Houston area. It aggregates LMP data across the Houston load zone into a single tradeable price that your retail electricity provider uses to structure and hedge your contract.
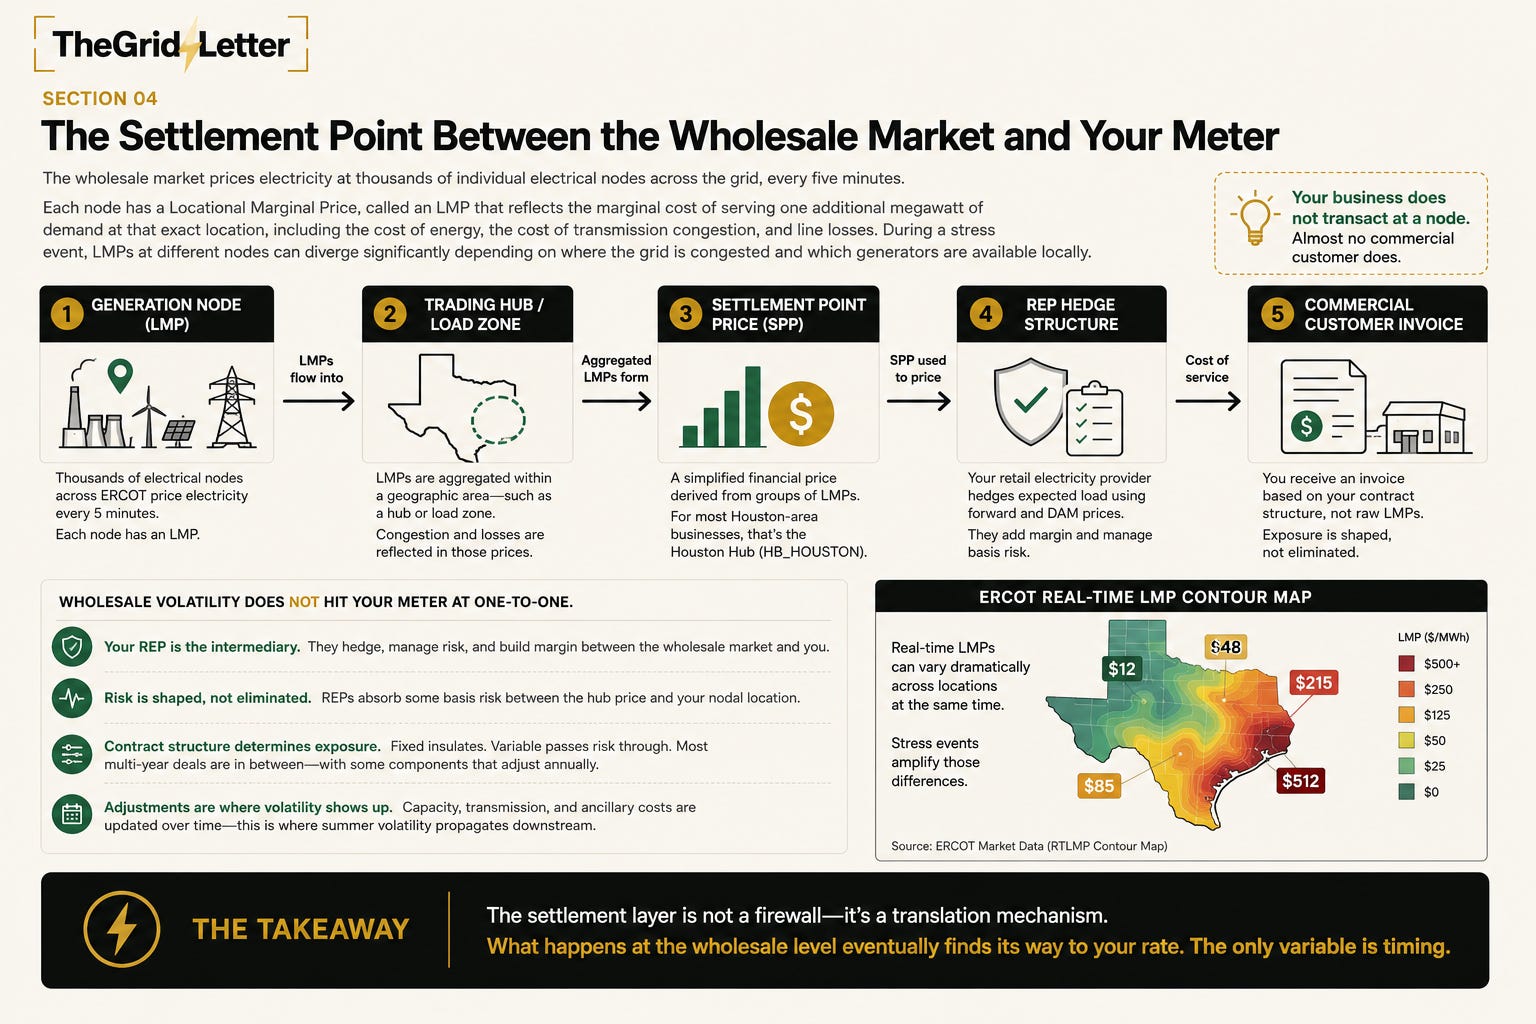
The practical implication is this: wholesale volatility does not hit your meter at one-to-one.
Your retail provider sits between the wholesale market and you. They hedge a portion of your expected load against forward prices and DAM prices. They build a margin into your rate.
They absorb some of the basis risk between the hub price and the nodal price at your specific location. What reaches you is a version of wholesale risk, shaped by how your contract is structured.
That shaping cuts both ways. A fully fixed contract insulates you almost entirely from real-time price swings (although through rate increases on contracts factoring past volatility, you’ll still feel the heat)
A variable or indexed contract passes wholesale exposure through directly.
Most commercial customers on multi-year agreements sit somewhere between those poles, with fixed energy charges but exposure to capacity, transmission, and ancillary service costs that adjust annually. Those adjustments are where summer volatility propagates downstream, even inside a contract that looks fixed on the surface.
The settlement layer is not a firewall. It is a translation mechanism. What happens at the wholesale level eventually finds its way to your rate. The only variable is timing.
Section 05
Summer Is When the Margin Gets Expensive
 summer seasonality chart comparing monthly average DAM prices and maximum price spikes across June–September of 2023, 2024, and 2025, showing that extreme summer price spikes significantly exceed average market prices, particularly during scarcity conditions.")
The 4CP window opens June 1.
Those four letters determine a line item on your electricity bill that most business owners have never heard of and cannot find on their invoice.
4CP stands for Four Coincident Peaks, the four highest demand hours on the ERCOT grid during June, July, August, and September. Your load during those four hours, measured against total grid demand, sets your share of transmission costs for the following calendar year.
That allocation shows up as a capacity charge embedded in your rate. It does not announce itself. It simply arrives.
ERCOT does not publish the peak hours in advance. They are identified after the fact. What the data does show is when they tend to occur: weekday afternoons between 3 PM and 7 PM, during the hottest days of August, when cooling load is highest and solar is fading.
The August 2023 data makes the window visible. A month that averaged $265 per megawatt-hour, with a single day breaching $1,081, produced the kind of demand spikes that set 4CP hours. Your load profile during those hours followed you into 2024 whether you knew it or not.
The forward strip reflects this.
Suppliers pricing 12 or 24-month contracts right now are building summer 2026 volatility into the rate they quote you today.
Every week that passes without a signed contract is a week closer to peak pricing being baked into your baseline. Locking before the summer strip fully prices in is not a guarantee of the lowest possible rate. It is a guarantee of pricing against a market that has not yet confirmed its worst case.
Your contract expiration date matters here. Rolling into an unplanned renewal during July or August means your supplier sets the terms against the most expensive forward curve of the year. That is not a negotiation. That is a default.
The reserve margin tightens as load climbs. Thermal outages cluster in heat. Evening solar contribution falls to zero.
The Operating Reserve Demand Curve (ORDC), ERCOT’s mechanism for pricing scarcity into real-time markets, activates when reserves fall below target thresholds, adding adders to the clearing price that compound on top of an already elevated marginal cost.
Those adders are not hypothetical. August 2023 produced them. January 2026 produced them. The conditions that generate them are present every summer to varying degrees.
Summer does not just raise prices. It widens the range of outcomes. The floor stays roughly where it was. The ceiling lifts.
” and “June (through ~June 15).” A secondary window in early September (~Sept 1–15) is highlighted in green. Below the main window, three columns explain the drivers stacking during late May to mid-June: Physical Stress (rapid shift to sustained cooling demand, ongoing thermal maintenance, declining wind output, increased reliance on natural gas, reduced supply flexibility), Financial Impact (May usage produces June bills, businesses react to invoices not forecasts, forward contracts already priced off stress conditions before bills arrive), and Narrative Amplification (media coverage of grid pressure and heat increases, search volume spikes, attention peaks, audience seeks answers). A parallel section for early September shows similar drivers: Physical Stress (heat accumulation, thermal strain, Gulf weather uncertainty affecting fuel supply), Financial Impact (September usage drives October bills, forward pricing reflects stress), and Narrative Amplification (renewed headlines and attention, increased concern leading to action). A bottom strip emphasizes key takeaways: “Bills lag reality” (May usage creates June bills; market moves before bills arrive), “Pricing leads the bill” (forward pricing absorbs the spike before it is visible), and “Timing is everything” (contracts signed in July are priced off June conditions; contracts signed in April are not). Final statement at the bottom: You do not need a crisis for all three drivers to align; heat, bills, and headlines arriving together create the effect, most reliably in late May through mid-June.")
Section 06
What Knowing This Changes
You now have a frame that most business owners in Texas do not have.
You know the grid prices at the margin, not the average.
You know renewables lower costs during calm hours and do nothing to protect you during stressed ones.
You know the settlement layer between the wholesale market and your meter shapes but does not eliminate your exposure.
And you know the window for acting ahead of peak pricing is measured in weeks, not months.
None of that requires you to become an energy analyst. It requires only three things.
Know what you are currently paying per kilowatt-hour, all-in, including capacity and transmission line items.
Know when your contract expires.
Know whether your rate structure has any variable components that pass through wholesale or capacity cost changes. Those three data points tell you whether you are positioned or exposed heading into summer.
Most commercial customers in Texas are exposed to elevated risk which diminish margins and do not know it.
Not because they made a bad decision but because the system is not designed to make that exposure visible.
The businesses that will pay more this summer than they needed to are not the ones that looked at the market and bet wrong. They are the ones that never looked.
The market is not going to get simpler. The load is not going to shrink. The evening ramp is not going to flatten as more solar comes online.
Understanding how this system prices risk is not an edge that expires. It compounds.
Sources
ERCOT Settlement Point Prices (SPP) — HB_HOUSTON, April 2026 ERCOT DAM
Daily Average Prices — HB_HOUSTON, 2023–2026 ERCOT Market Prices Dashboard
ERCOT Real-Time LMP Contour Map — ercot.com/content/cdr/contours/rtmLmp.html
ERCOT ORDC Biennial Report, 2022
The Bill Is Coming: Why Texas Business Owners Can No Longer Ignore the Power Market — TheGridLetter, April 22, 2026