

TheGridLetter makes the Texas power market easy to understand. As ERCOT and Texas electricity markets change, we deliver clear, trusted analysis on grid conditions, pricing, and policy so you can stay ahead.
A month ago, I published the first phase of a series tracking El Niño and what it could eventually mean for Texas.
The point wasn’t to predict another Winter Storm Uri.
It was actually much simpler than that.
Texas is entering this winter with a very different power grid, while an increasingly unusual weather pattern develops around it. More wind. More solar. Far more batteries. Higher demand. And a market where a surprisingly small number of hours can still carry an outsized amount of economic weight.
Since then, another variable has become worth adding to the board:
The polar vortex.
Before getting into that, though, I want to start with something much closer to home.
Five days can change an entire year
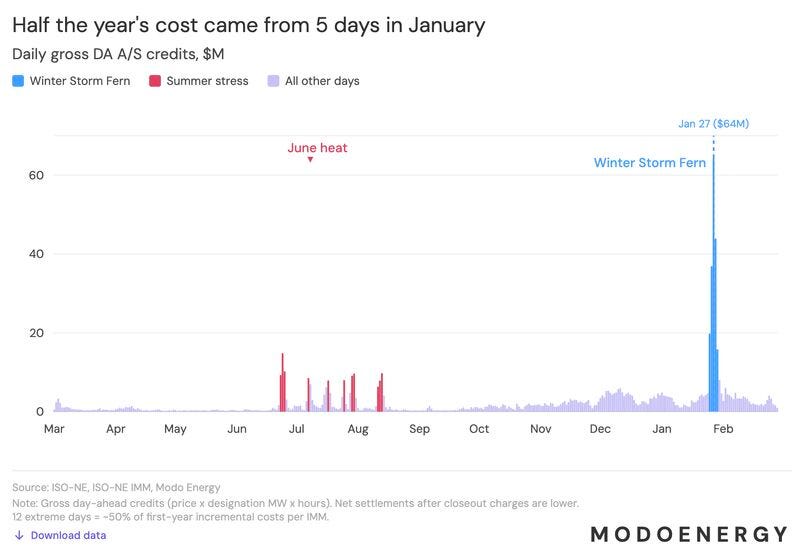
This chart is probably one of the simplest ways to explain why I spend so much time thinking about extreme weather in power markets.
During Winter Storm Fern, just five days in January accounted for roughly half of the year’s gross day-ahead ancillary-service credits represented in Modo Energy’s analysis.
Look at everything surrounding the spike.
Most days are relatively uneventful. There are periods of summer stress, and costs gradually increase heading into winter, but nothing remotely resembles those few days in January.
Then the wrong conditions overlap.
That’s the strange thing about electricity markets.
You don’t need 365 days of grid stress to create an expensive year. You need weather, demand and generation availability to move against each other for long enough.
I wrote essentially the same thing in “Tracking El Niño and What It Means for Texas: Phase 1”
What has changed since then is that we can start getting more specific about what that overlap could actually look like this winter.
And that’s where the polar vortex enters the story.
So, what does the polar vortex have to do with this?
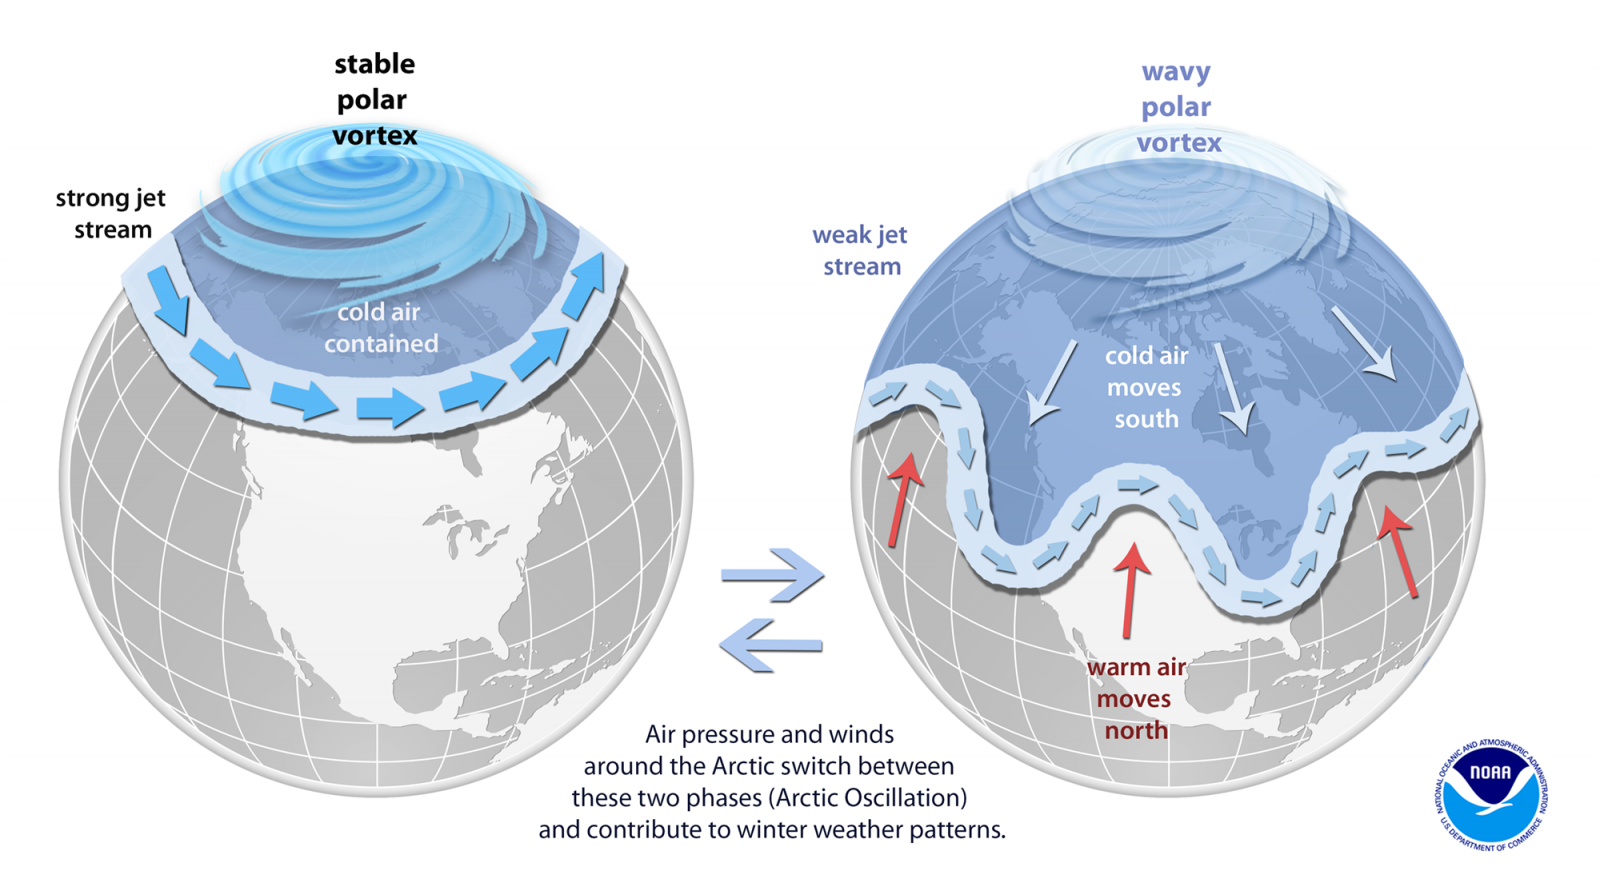
The polar vortex isn’t a storm.
It’s a large circulation of cold air around the Arctic that becomes particularly important during winter. When that circulation is relatively stable, the coldest Arctic air tends to remain farther north.
When it becomes significantly disturbed, things can get more interesting.
The jet stream can become increasingly distorted, creating pathways for Arctic air to move much farther south into the United States.
That does not mean a disrupted polar vortex automatically freezes Texas. The atmospheric setup still has to line up correctly for that cold air to actually reach us.
But we’ve seen what can happen when it does.
2021 gave us a real-world example
About a month before Winter Storm Uri, a major sudden stratospheric warming event disrupted the polar vortex.
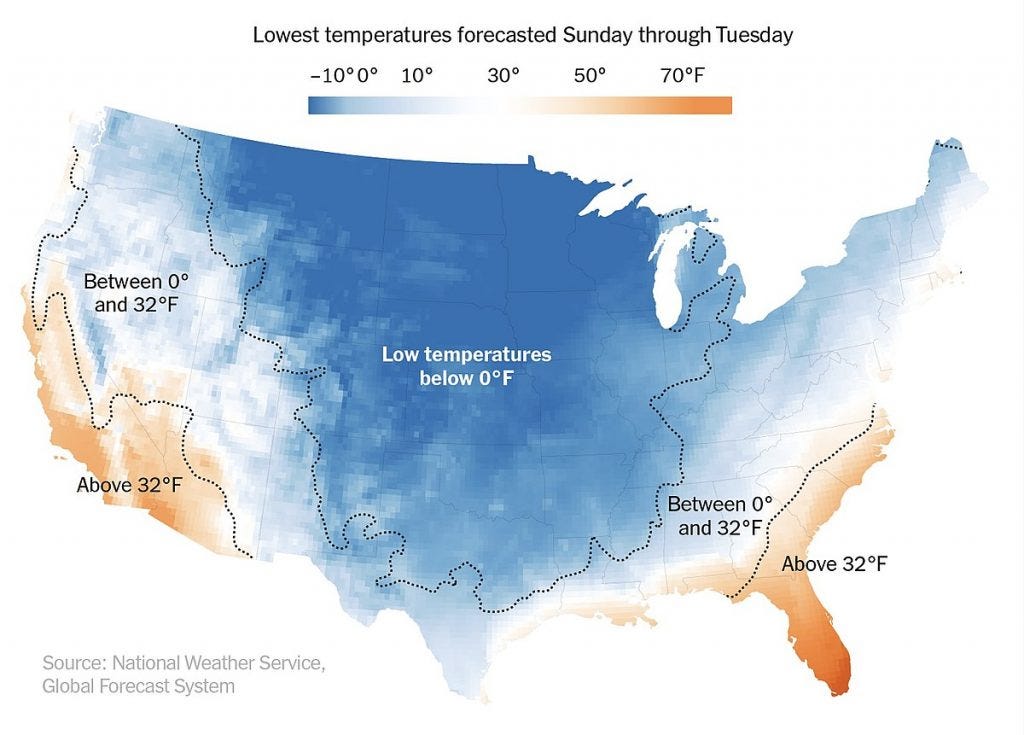
What followed was a strongly negative Arctic Oscillation and a broader atmospheric pattern that eventually helped extremely cold Arctic air penetrate deep into North America.
By mid-February, it had reached Texas.
The important lesson isn’t that polar vortex = another Uri. The 2021 event involved multiple atmospheric factors, and the grid failure itself involved widespread thermal generation outages and fuel-supply problems alongside renewable losses.
The lesson is much simpler:
Extreme demand and generation availability can deteriorate at the same time.
And the ERCOT grid that would experience that collision today looks very different from the one that experienced it in 2021.
The grid is different now
This is where the 2026 setup gets more interesting.
Since Uri, Texas has added enormous amounts of wind, solar and battery storage. That has given ERCOT access to huge volumes of low-marginal-cost electricity when those resources are available.
But availability is the key word.
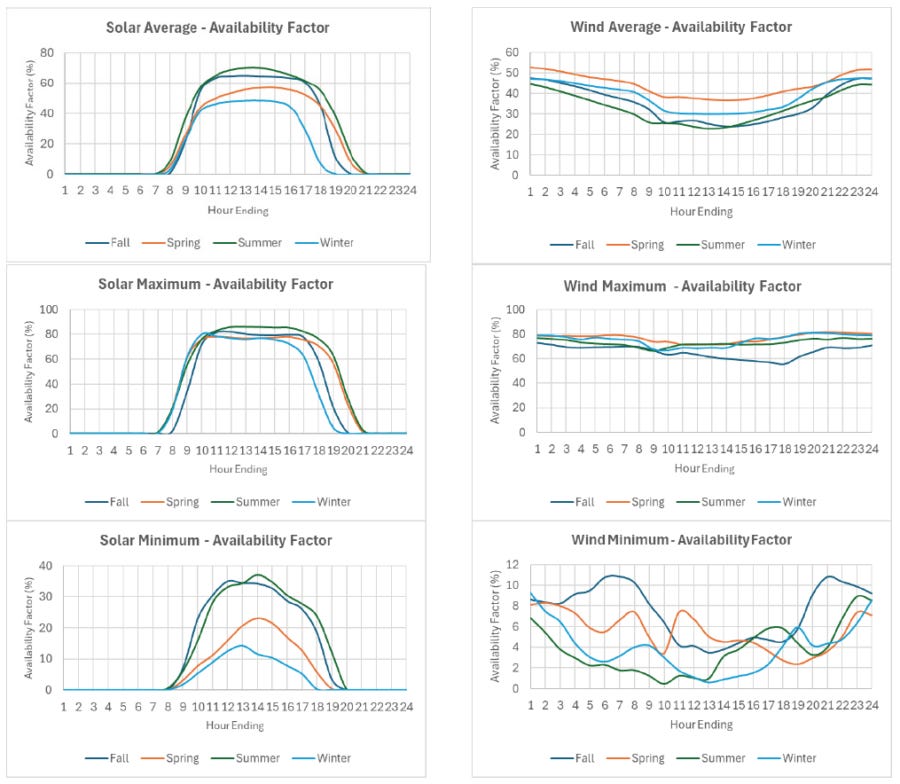
Look specifically at the winter profiles.
Solar is straightforward. Overnight, it’s unavailable. During winter daylight hours, its average availability is also lower and its generation window shorter than during summer.
Wind is more interesting.
Under average winter conditions, wind can contribute substantially throughout the day. But ERCOT’s minimum winter profile falls into the low single digits during portions of the day.
Neither of those things is inherently a reliability problem.
The risk is when they correlate with everything else.
Imagine an extended Arctic outbreak: temperatures fall, electric heating demand rises, solar disappears during the overnight and early-morning hours, wind enters a low-output period, and thermal generation and natural-gas infrastructure are simultaneously being tested by extreme cold.
Batteries can help bridge those gaps—and Texas has far more storage today than it did during Uri—but batteries ultimately move energy across time. They don’t create it.
This is why I’m increasingly interested in net load, rather than installed generation alone.
The real question during an extreme winter event isn’t how many megawatts Texas has on paper.
It’s how much generation is actually available during the exact hours we need it most.
This is where El Niño comes back into the picture
El Niño and the polar vortex are not the same phenomenon, and one does not guarantee the other.
But they can influence different pieces of the same winter setup.
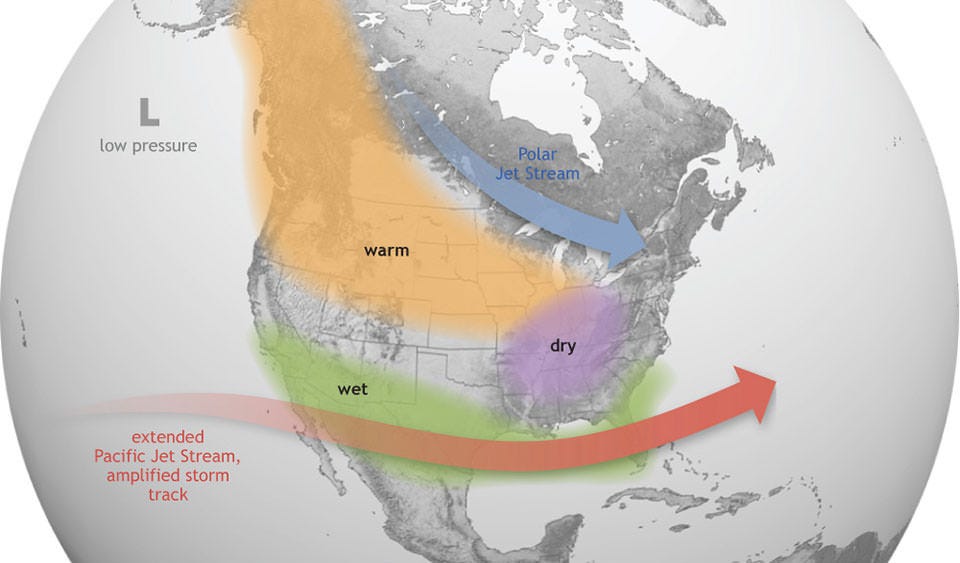
As I covered in Phase 1, El Niño tends to strengthen and extend the Pacific jet farther south, increasing the tendency for stormier and wetter conditions across the southern United States, including Texas.
A disrupted polar vortex can introduce a different ingredient: a pathway for Arctic air to move south, assuming the broader atmospheric circulation lines up correctly.
The tail scenario is what happens if those ingredients eventually overlap.
Cold from the north. Moisture and an active storm track from the south.
Now place that over an ERCOT system experiencing elevated winter demand, variable wind and solar availability, energy-limited batteries, and thermal generation being tested by prolonged cold.
That’s the convergence I’m watching.
Not because it means another Uri is coming.
But because electricity markets become most interesting, and potentially most expensive, when several individually manageable variables begin moving against the system at the same time.
The economics live in the tails
This is where weather risk becomes power-market risk.
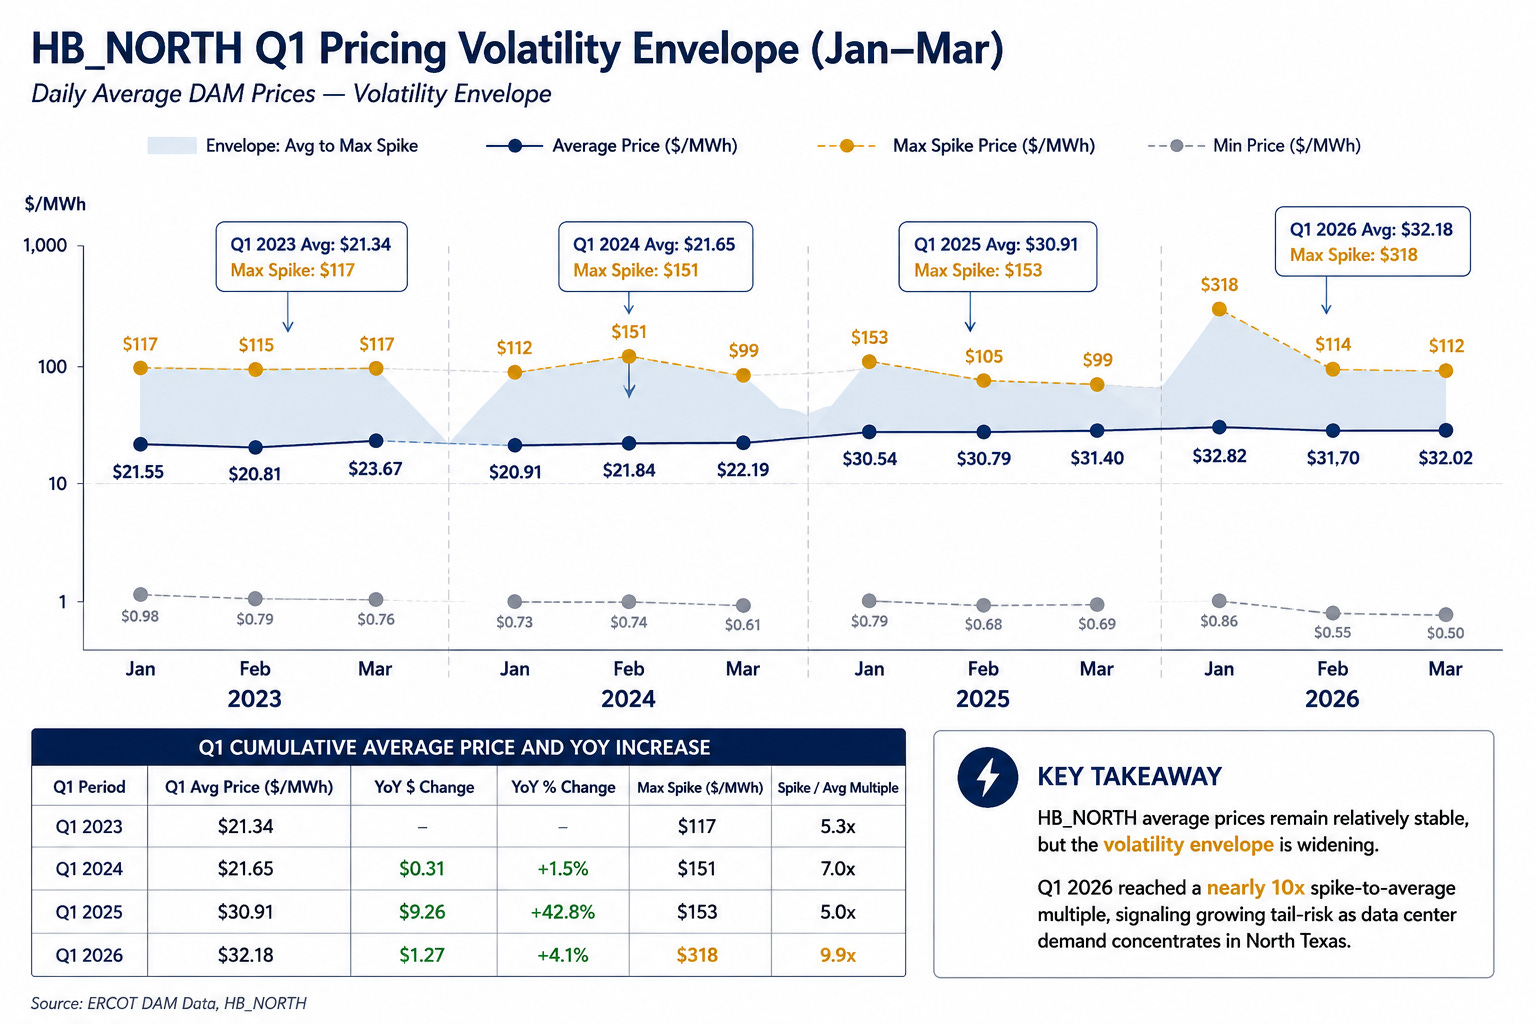
Average power prices only tell part of the story.
In my own HB_NORTH work, average Q1 day-ahead prices remained relatively contained across the period shown. But the extremes tell a very different story, with the upper end of the monthly range reaching roughly $318/MWh in January 2026.
That’s the part I care about.
A facility can experience months of relatively ordinary power economics and then encounter a handful of hours or days where the market behaves completely differently.
We saw the same principle with Winter Storm Fern: a disproportionate amount of economic exposure can become concentrated into an incredibly small window of time.
And as Texas adds load while simultaneously changing how and when electricity is produced, understanding those tails becomes increasingly important.
The average tells you what the market normally looks like.
The envelope tells you what you’re actually exposed to when it stops behaving normally.
What I’m watching from here
None of this means Texas is headed for another Uri.
There are still a lot of pieces that would have to fall into place. The polar vortex would need to become meaningfully disrupted (which seems likely), the downstream atmospheric pattern would need to favor Arctic air reaching Texas, and that cold would then need to overlap with the wrong combination of load and generation availability.
But that’s exactly why I’m tracking this in real time.
Phase 1 was about recognizing that the setup was worth watching.
Phase 2 is about defining what we’re actually watching for.
From here, I’ll be paying attention to the polar vortex and Arctic Oscillation, the path of the jet stream, Texas temperature forecasts, wind and solar availability, battery behavior, thermal generation and eventually the first meaningful cold fronts that test the system.
Because in ERCOT, it doesn’t have to go wrong for an entire winter.
Sometimes a few days are enough.
Heres a +1, so to speak
I’m also the founder of Polaris, a Houston-based energy intelligence platform.
If you operate a large commercial or industrial facility in Texas, we generate independent Economic Power Reports at no upfront cost as part of our market initiatives.
The report is designed to give you a clearer picture of your facility’s position in the Texas power market, what you’re currently paying, where potential savings may exist, and where your power position may be exposed as the market changes.
You can’t control the weather or what happens across ERCOT.
You can understand your position before the market forces you to make a decision.
And because Texas is home for both me and Polaris, I’m committing 30–40% of Polaris revenue generated during Q4 to children’s organizations and food banks across Texas.
Whatever this winter ultimately looks like, I want part of what we’re building to flow back into the communities we operate in.
Jump into these next


Does renewable generation suppress or amplify Texas power prices?

A short look at one week of ERCOT pricing data, and what it suggests about the tradeoff Texas is making as wind and solar take on a larger share of the grid.