

Here's How AI and Data Centers Are Quietly Reshaping Texas
The state didn't get "lucky". It built the conditions decades ago and now those conditions are being pushed to their limits.

Table of Contents
Section 01 — The Numbers That Changed Everything
Section 02 — What The Data Actually Shows
Section 03 — Why This Isn’t A Temporary Spike
Section 04 — What The Market Doesn’t Make Easy To See
Section 05 — What The Grid Is Doing Right Now
Section 06 — What Paying Attention Looks Like
Summary
The ERCOT large-load interconnection queue grew nearly 300% in a single year from a base that was already unprecedented and data centers now account for more than 70% of the 233+ gigawatts waiting in line.
That concentration exists because Texas spent decades removing the friction that slows grid growth everywhere else in the country.
Commercial, industrial, and residential buyers who signed contracts before this demand curve became visible are approaching renewals in a market that no longer resembles the one that priced those deals.
If you’re new here, start with these:
How ERCOT Prices Electricity — A Plain-Language Guide
Understanding 4CP: Why Texas Electricity Prices Spike Every Summer

Section 01
The Numbers That Changed Everything
Texas didn’t just get “lucky” with data centers. It built the conditions for them decades ago.
The result of that construction is now visible in a single dataset: ERCOT’s large-load interconnection queue.
By the end of 2025, it held more than 233 gigawatts of pending requests. Data centers account for over 70% of that total. One year earlier, the queue was a fraction of that size, meaning it grew nearly 300% in twelve months alone.
For context, Texas’s current real-time grid load runs around 64 gigawatts. The queue represents demand requests that, if fully built, would require the grid to support three to four times what it serves today.

Most commercial electricity buyers in Texas are aware that something is happening with the grid.
Fewer understand that the structure of the market has already shifted around them. The queue isn’t just a forecast though, It is a signal of where demand is heading and the pricing implications are already appearing in real-time settlement data.
Section 02
What The Data Actually Shows

The load forecast numbers are large enough to require grounding before they land.
ERCOT’s own adjusted planning forecast shows peak demand rising to approximately 138 gigawatts by 2030 and 154 gigawatts by 2035. The TSP-provided forecast, a separate scenario developed from utility transmission service providers, puts the upper bound at 218 gigawatts by 2030.
These two numbers should not be averaged or split. They represent a genuine range of uncertainty. ERCOT itself discounts data center requests in the adjusted forecast by roughly 73% from maximum demand, to account for ramp uncertainty and what the industry calls “phantom” load, speculative interconnection requests that may never materialize.
The lower-bound scenario is plausible. So is the upper. The honest answer is that no one knows exactly how much of this queue becomes real load, or how fast.
What is not uncertain: the direction.
Historical ERCOT peak demand was flat for more than two decades, plateauing in the 75–85 gigawatt range from 2002 through 2024. The forecast inflects sharply starting in 2025. Annual energy consumption is projected to more than double, from approximately 461,000 gigawatt-hours in 2024 to roughly 1.14 million gigawatt-hours by 2035.

Now, pricing knows no limits nor morality therefore it’ll always be a reliable indictor of economic and systematic stress.
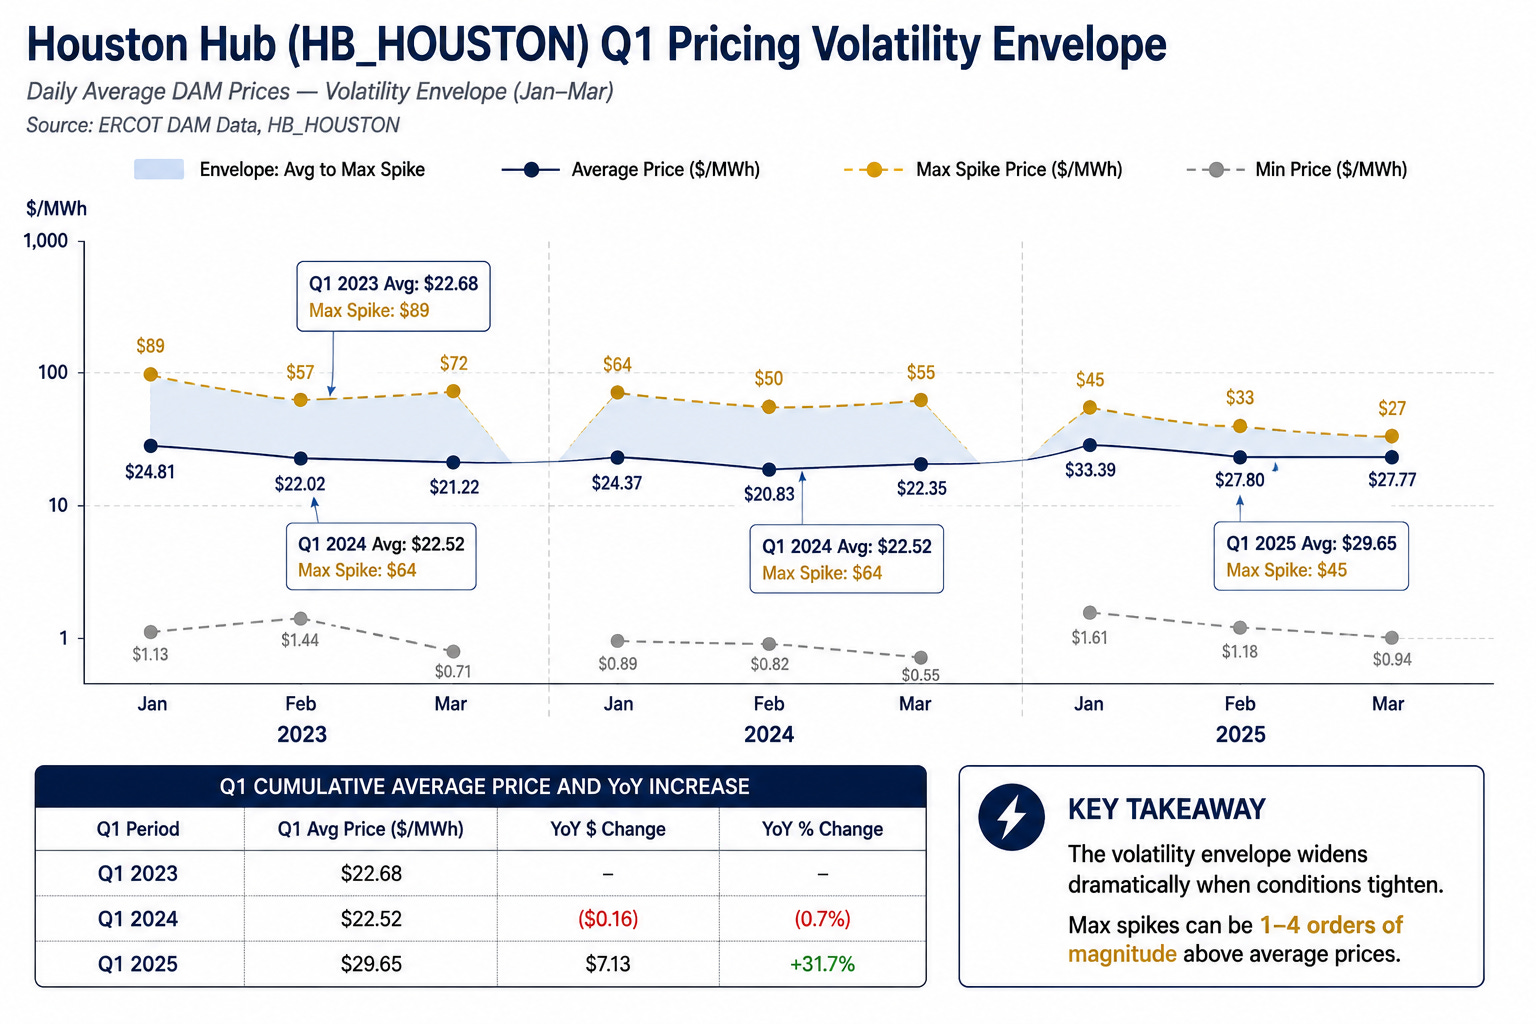
At Houston Hub (HB_HOUSTON), Q1 average settlement point prices rose 31.7% between 2023 and 2025, from $22.68 per megawatt-hour to $29.65. That is not a spike. That is a rising average, which is a different and more durable problem.
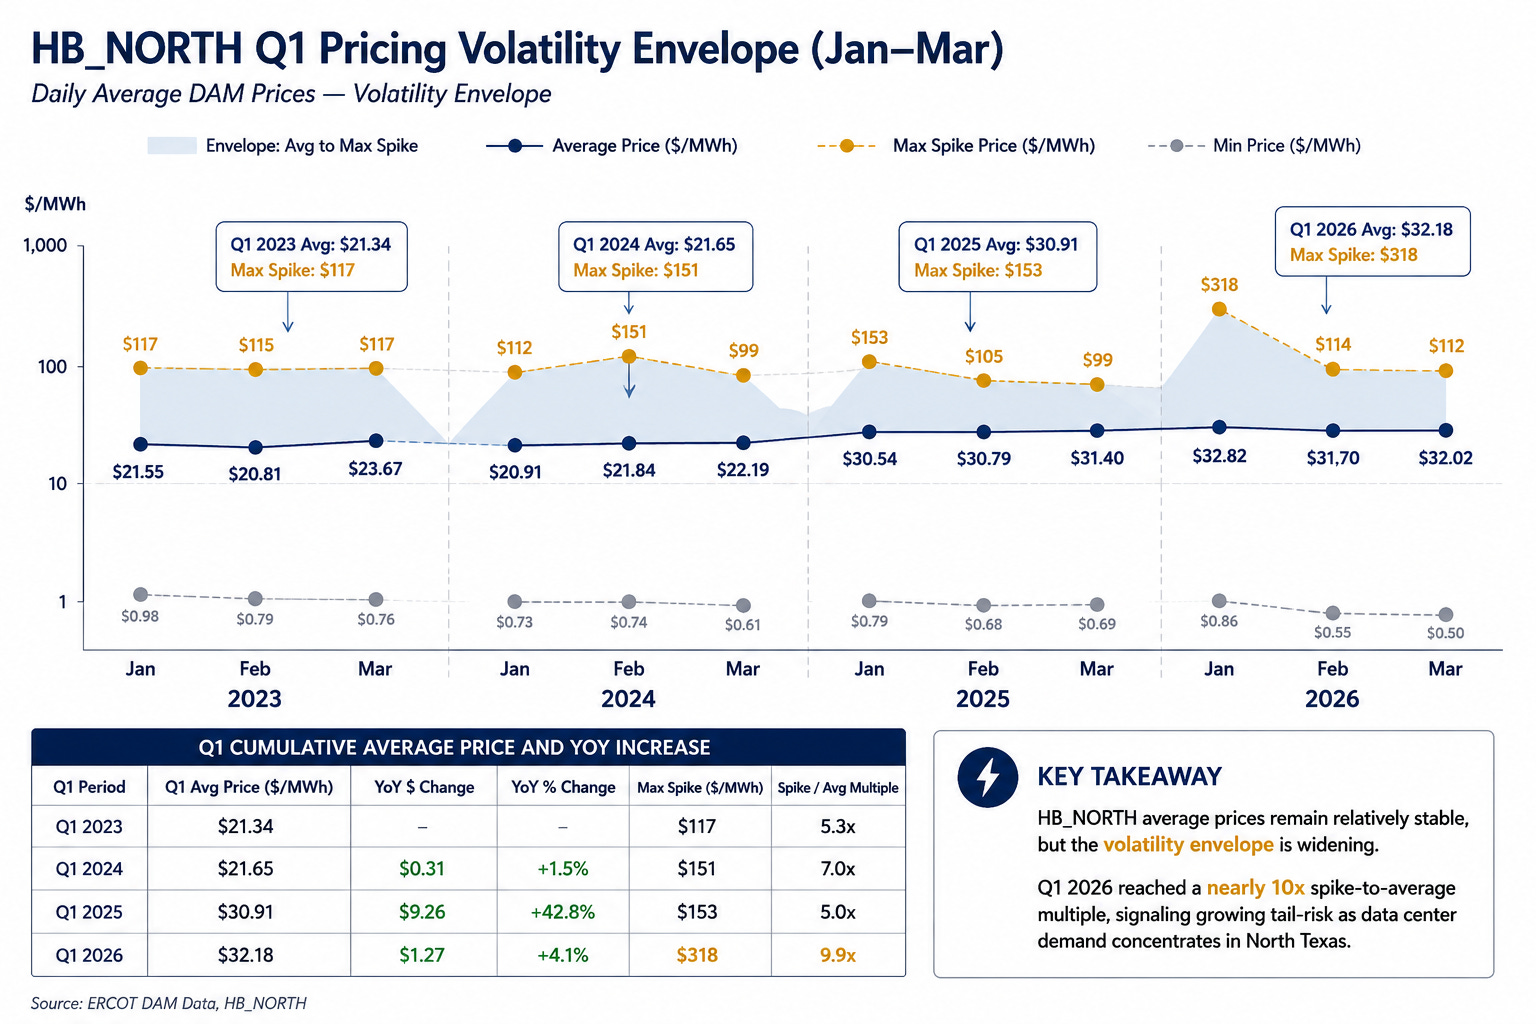
The North Hub tells a sharper version of the same story. In January 2026, HB_NORTH posted a spike-to-average multiple of 9.9 times. The average settlement price for the period was $32.18 per megawatt-hour. The intra-period maximum hit $318. That multiple, nearly ten dollars of maximum price for every one dollar of average, does not happen in a grid with comfortable reserve margins and short-term stability.
The delta between a commercially-locked fixed rate and spot exposure is going to widen over the 2025–2030 window.
That is not because spot prices will spike on every trading day they won’t. It is because the floor is rising and the ceiling is getting higher.
Both movements work against unhedged buyers.
Section 03
Why This Isn’t A Temporary Spike
The standard mental model for electricity price spikes treats them as weather events. Something causes unusual demand. Prices jump. The event passes. Prices fall back.
That model doesn’t apply here.
Texas built its grid advantages intentionally, over decades, through a specific set of structural choices. ERCOT is an intrastate ISO, a single entity operating more than 37,000 miles of transmission lines entirely within Texas. Because the system doesn’t cross state lines in a meaningful way, it sits outside FERC jurisdiction. (FERC, Federal Power Act exemption documentation) The Public Utility Commission of Texas and the Texas Legislature are the relevant regulators, not boards in Washington. That regulatory insulation allowed Texas to move faster on generation interconnection, price discovery, and market structure than any other region in the country.
The interconnection speed differential is the clearest illustration. PJM’s average application-to-commercial-operation timeline ran under two years in 2008. By 2025, that same process took over eight years. (RMI, February 2026; Grid Strategies Generator Interconnection Scorecard, March 2024)
ERCOT, through 2023, averaged 22.2 months, compared to CAISO’s 43.4 months and PJM’s 24.4 months at the time. (Clean Power Association Interconnection Fact Sheet, 2023) Faster interconnection meant more generation built sooner. More generation meant competitive retail pricing. Competitive retail pricing meant lower costs for large consumers. Lower costs attracted hyperscale buyers. Their arrival drove more generation investment. The loop fed itself.
That positive feedback loop is now self-stressing. The data center queue has outgrown the process designed to absorb it. ERCOT VP Kristi Hobbs said it directly in December 2025: “We have outgrown the process.”
The median battery storage project timeline has stretched from 3.5 years to 4.1 years. Senate Bill 6 reform is underway, but the queue is already deep. The speed advantage that defined ERCOT’s first era is under pressure from the very demand it created.
A useful reference point: this is what it looks like when infrastructure built for one scale of demand encounters the next scale. US data centers consumed approximately 415 terawatt-hours of electricity globally in 2024, roughly 1.5% of total global electricity use, growing at 12% annually.
The IEA’s base-case projection puts that figure near 945 terawatt-hours by 2030. By that point, US data centers alone are projected to exceed total heavy manufacturing electricity consumption. A hyperscale data center draws 100 to 500 megawatts continuously (90-100% uptime), with no demand response, no seasonal dip, and no off-peak moderation. These loads compress reserve margins at the exact hours when grid operators historically relied on industrial flexibility to buffer system stress.
The grid hardened for weather after Winter Storm Uri. During Winter Storm Elliott in December 2022, ERCOT set a winter demand record of 74,100 megawatts. Physical responsive capability never dropped below 4,052 megawatts. There was no Emergency Energy Alert declaration. (ERCOT Winter Storm Elliott Public Report, March 2023)
Contrast that with Uri, which triggered an EEA Level 3 declaration and resulted in the loss of 48.6% of installed capacity at peak. The weatherization effort worked.
But weatherization addresses weather. It does not address the demand curve. The new structural challenge is different: hardening legacy infrastructure while simultaneously interconnecting hundreds of gigawatts of new always-on load, with the same capital budget, the same transmission corridors, and the same time constraints.
Those two objectives are not easily reconciled. You cannot harden existing assets and build net-new transmission at the same pace when one is consuming the resources the other needs.
This is why the price signals at HB_NORTH aren’t one off. They are simply previews.
Section 04
What The Market Doesn’t Make Easy To See
The data center load concentration in North Texas is not uniformly distributed across the ERCOT grid. It clusters. Dallas, Houston, San Antonio, and Austin carry the highest suitability scores, but the density around North Texas is striking.
That geographic concentration maps directly onto the HB_NORTH hub boundary. The 9.9 times spike multiple in January 2026 is not a market-wide event. It is a localized event at the exact hub where the load is heaviest.

Most commercial electricity buyers in Texas operate without a clear view of this. The information required to fully understand your supply position as a C&I buyer is not presented in a single place. It exists across settlement point price feeds, interconnection queue reports, forward curve data, contract terms, and demand charge calculations. None of these are difficult to find individually. Together, they require either dedicated staff or a procurement process designed to surface them.
What that information gap creates in practice:
The competitive quoting gap.
Most commercial buyers receive pricing from one or two retail electric providers.
A full market process; running quotes across the available REP market simultaneously, typically surfaces a materially different price range. The spread exists because REPs price risk differently based on their own book positions.
Without competitive tension in the quoting process, buyers absorb whatever margin the counterparty has elected to take.Hidden cost mechanisms.
Three cost components determine a commercial electricity bill in Texas beyond the energy charge itself. Demand charges reflect peak kilowatt draw in a given month. 4CP transmission costs are calculated from your facility’s load during the four highest demand hours on the ERCOT grid each summer; June through September and that calculation determines a portion of your transmission charges for the entire following year.
Capacity charges reflect grid-wide reserve margin obligations allocated to buyers based on load profiles. Together, these can represent 30–50% of a commercial electricity cost. Most buyers know they exist. Fewer know how each is calculated or what operational decisions affect them.The compounding cost of not knowing.
A C&I buyer who signed a two-year fixed contract in 2022 at market rates for that year made a reasonable decision with the information available.
That same buyer, renewing in 2025 or 2026, is entering a structurally different market. The average price at Houston Hub Q1 2025 is 31.7% higher than Q1 2023. North Hub is posting 9.9 times spike-to-average multiples. The ERCOT queue holds 233 gigawatts of new load.
A renewal priced without a full market process, against a backdrop of rising averages and widening volatility, costs more than the rate difference on any single contract. It costs the delta between informed and uninformed procurement compounded across a multi-year term.
C&I Savings Calculator | Estimates based on ERCOT + Internal benchmarks
Section 05
What The Grid Is Doing Right Now
The 4CP window opens in June. It closes in September.
Those four months contain the four highest demand hours on the ERCOT grid for the year and the load your facility carries during those specific hours determines a portion of your transmission costs for the entire following twelve months.
This is not a fee that adjusts month to month and is set once, based on peak summer performance, and applied across the calendar year ahead. For a C&I buyer with significant demand exposure, the difference between active load management during 4CP windows and passive operation during those same hours can represent tens of thousands of dollars in annualized cost.
The forward curve is reflecting current market conditions in the pricing available to buyers locking contracts now versus contracts locked after summer peaks are established. Rates priced before summer carry different uncertainty premiums than rates priced after the grid’s peak demand profile is known. It’s how forward markets work.
What is different in this market is the magnitude of the uncertainty being priced. With 233+ gigawatts of pending large-load requests and a forecast inflection point that has no historical precedent in ERCOT data, the premium for post-peak certainty is larger than it has been in prior years.
Contract expiration mechanics matter here. A commercial buyer whose fixed-rate contract expires during or after summer peak season faces a renewal in a market with fresh volatility data. A buyer whose contract expires before the 4CP window has time to evaluate forward pricing before that data exists. Neither timing is inherently better. But understanding which position you are in determines what information you need to gather and when.
The supply and demand gap is not closing in the near term. The infrastructure required to serve the demand coming into ERCOT’s queue takes years to interconnect and build.
The grid will face repeated localized scarcity events with rising average prices as the structural baseline, not as episodic exceptions. That is the condition buyers are pricing against when they sign contracts in this market.
Section 06
What Paying Attention Looks Like
Three things put you in a different position than most commercial buyers in Texas right now.
The first is knowing what you currently pay fully, not just the energy rate. Pull your last twelve months of bills and calculate the total delivered cost per kilowatt-hour, including demand charges, transmission fees, and any capacity components. Most buyers who do this for the first time discover their effective rate is meaningfully different from the rate they negotiated. That number is your baseline. You cannot evaluate a renewal or an alternative offer without it.
The second is knowing your contract expiration date and what happens after it. If your contract expires and you have not signed a renewal, you likely roll to a variable or indexed rate at whatever the market is doing at that moment. In the current market, that moment matters. Know the date. Know the default terms. Know whether your REP provides any notice period before the rollover takes effect.
The third is understanding your demand exposure before the 4CP window opens in June. If your facility has significant peak demand; heavy HVAC load, industrial equipment, high-draw operations then you have some ability to manage when that demand hits the grid during the four critical summer months. That management is not complicated, but it requires knowing the window exists and what the operational levers are.
None of this requires a consultant.
It requires the same attentiveness you apply to any other major cost center in your operation.
The Texas electricity market is genuinely complex, and it is getting more complex as load growth accelerates. But the buyers who navigate it well are not the ones with the most sophisticated models. They are the ones who know their numbers, know their timing, and ask the market for competitive pricing rather than accepting the first offer placed in front of them.
Texas built a grid that runs on competition. That competition works in your favor only if you participate in it.
Primary Sources
ERCOT — 2025–2031 Long-Term Load Forecast Update and Methodology Changes April 7, 2025 https://www.ercot.com/files/docs/2025/04/07/8.1-Long-Term-Load-Forecast-Update-2025-2031-and-Methodology-Changes.pdf
ERCOT — Winter Storm Elliott Cold Weather Operations Public Report March 27, 2023 https://www.ercot.com/files/docs/2023/03/27/December-2022-Cold-Weather-Operations-Public-Report.pdf
ERCOT — Real-Time Market Documentation (SCED/LMP, Settlement Point Prices) Ongoing https://www.ercot.com/mktinfo/rtm
FERC — Introductory Guide to Electricity Markets (ERCOT Jurisdictional Exemption) Ongoing https://www.ferc.gov/introductory-guide-electricity-markets-regulated-federal-energy-regulatory-commission
International Energy Agency — Energy and AI Report 2025 https://www.iea.org/reports/energy-and-ai
Utility Dive — "ERCOT's Large Load Queue Jumped Almost 300% Last Year" January 6, 2026 https://www.utilitydive.com/news/ercots-large-load-queue-jumped-almost-300-last-year-official/808820/
Utility Dive — "Reliability Risk Isn't Just About Capacity Anymore" March 2026 https://www.utilitydive.com/news/winter-texas-reliability-risk-capacity-ercot/811748/
Internal / Original Data Work
TheGridLetter Analysis — Q1 Volatility Envelope, HB_HOUSTON, 2023–2025 Source data: ERCOT Settlement Point Prices, HB_HOUSTON, Q1 hourly real-time data
TheGridLetter Analysis — Q1 Volatility Envelope, HB_NORTH, 2023–2026 Source data: ERCOT Settlement Point Prices, HB_NORTH, Q1 hourly real-time data