

The Grid Behind the Lights: Understanding ERCOT and Why Texas Energy Is the Market Most People Sleep On
Friend or Foe? A deep-dive into ERCOT
There are 34,000 miles of transmission lines running through Texas. 464 terawatt-hours of electricity generated in a single year. Enough to power every home, business, data center, and strip mall in the second-most populated state in the country — and only one organization sitting at the controls.
No, it’s not BlackRock. It’s not a government agency either, at least not in the way most people think. It’s not a utility, and it’s not your electricity provider.
It’s ERCOT.
Most Texans have heard the name, usually during a winter storm or a summer heat warning when the news starts throwing around phrases like “grid stress” and “conservation appeal.” But the conversation almost always stops there: ERCOT bad, power outages bad, move on. What never gets explained is what ERCOT actually is, how the market it oversees actually functions, and why any of this matters beyond keeping your lights on.
That’s what this piece is for.
By the end of it, you’ll understand why Texas runs a fundamentally different electricity system than almost anywhere else in the country, how the price you pay for power is actually calculated, and why I think the Texas energy market is quietly becoming one of the more interesting economic stories of this decade. Not because of some hot take, but because of what’s already happening — and what the data is already showing.
This is a long one. Bookmark it.
Part One: Why Texas Is Different (And Why That Actually Matters)
Let’s start with the thing that separates Texas from virtually every other state: deregulation.
In most of the United States, electricity works like a utility. A single company generates the power, owns the wires, and sends you a bill. You don’t choose your provider. You don’t have exposure to wholesale market prices. You pay whatever the regulated rate is, set by a state commission, and that’s the end of it.
Texas, for the most part, is not that.
In 2002, Texas restructured its electricity market. The goal was to introduce competition: if generators had to compete for customers, prices would theoretically drop, efficiency would improve, and consumers would have choices. Today, roughly 90% of the state’s load is served through a deregulated market. If you’ve ever gone online and compared electricity plans the way you’d compare phone plans — that’s deregulation at work.
But deregulation doesn’t mean no structure. It means a different kind of structure, and ERCOT is the organization that holds it together.
Texas also made another consequential decision: its grid is largely islanded. The ERCOT grid connects with neighboring states only through a small number of limited DC ties, not the kind of deep integration that would make it part of the Eastern or Western Interconnection. This was a deliberate choice, rooted in a desire to keep the grid under Texas jurisdiction and out of federal regulation. The Federal Energy Regulatory Commission (FERC) oversees interstate electricity commerce. Texas, by staying disconnected, largely avoids FERC oversight. The grid is Texas’s to run.
That independence is both a strength and a vulnerability, and understanding it is the first step to understanding everything else.
Texas by the numbers:
The scale here is genuinely staggering. Texas is the largest electricity-consuming state in the country — consuming more than twice as much energy as California, the second-highest state, and more than three times as much as Florida. Between 2007 and 2023, Texas’s energy consumption increased 21%, while U.S. energy use decreased 5% over the same period. U.S. Energy Information Administration On the production side, ERCOT’s total generation reached 464 TWh in 2024, Dallas Fed a figure that continues to climb. Texas leads the nation in wind generation and is the second-largest solar producer, with utility-scale solar growing nearly four times over between 2021 and 2025. U.S. Energy Information Administration Wind and solar together now supply roughly 36% of ERCOT’s total electricity.
Projected demand growth adds another layer. ERCOT projects that peak demand could increase from approximately 85,000 MW today to as much as 145,000 MW within five years, Sierra Club driven by data centers, AI infrastructure, crypto mining, and continued population growth. The EIA is even more direct about the near term: electricity demand within ERCOT is expected to grow at an average rate of 11% in 2025 and 2026, making it the fastest-growing grid in the United States. U.S. Energy Information Administration The reasons behind that growth are worth understanding on their own, which is where we’re headed next.
Part Two: Energy as an Emerging Market
There’s a pattern that shows up every time a major technological shift happens: the infrastructure that new technology runs on becomes extraordinarily valuable, usually before most people think to look at it.
When the internet scaled in the late 90s, the obvious play was the software companies. The less obvious play — the one that became obvious in hindsight — was the fiber, the data centers, the physical plumbing that made the internet real. The same logic applies here, just with electrons instead of fiber.
AI and data centers are not a cyclical trend. That point is worth sitting with. S&P Global Energy, framing their 2026 Global Power Markets Conference, put it plainly: AI and data centers aren’t a cycle, they’re a new baseline. Load forecasts are being revised multiple times per year because the growth keeps coming in faster than modelers expected. Reliability risk has moved from an operational concern to a board-level issue at major companies.
Think about what that means structurally. Every query run through a large language model requires compute. Every dollar of compute requires power. The equilibrium between human consumption of electricity and technological consumption of electricity is shifting, and it's shifting quickly. From artificial intelligence to electric vehicles, business growth and power-hungry tech applications are driving up energy demand, making accurate forecasting more crucial than ever Texas Comptroller — and ERCOT is revising those forecasts constantly just to keep up.
That’s not a metaphor. It’s a procurement challenge.
The grid constraints this creates are real. Intermittency without firming capacity isn’t financeable, which is why S&P Global frames “clean plus reliable” as the actual benchmark, not “clean only.” Portfolio diversity equals investment confidence. Technology alone won’t solve the growth problem — it requires alignment across policy, capital, infrastructure, and operations. Execution risk now outweighs strategy risk.
Here’s the thing about energy that most people miss when they’re scanning headlines for the next big market: it’s not glamorous. It doesn’t have a founder giving TED talks. It doesn’t trend on social media. But it is the substrate. Everything that does trend, everything that does have a founder giving TED talks, runs on it. Understanding the infrastructure underneath the thing everyone is paying attention to is, historically, a very good way to see what’s coming.
Texas is where a lot of this is landing. The data center buildout happening across the state right now is not a rumor. It’s in the interconnection queue. It’s in ERCOT’s demand forecasts. It’s in the load growth numbers that keep getting revised upward. The state’s combination of land, relatively low-cost power, and deregulated market structure has made it a destination.
This is the context you need to understand why ERCOT, and the market it runs, is worth understanding closely.
Part Three: What ERCOT Actually Is (And What It Isn’t)
ERCOT stands for the Electricity Reliability Council of Texas. The name tells you something: reliability is first. It was established in 1970 and became the ISO (Independent System Operator) for the Texas market as part of deregulation.
Here’s the cleanest way to understand ERCOT’s role: it’s the referee and the game board. It does not own generation. It does not own transmission lines. It does not sell you electricity. It operates the bulk power system, runs the wholesale market, and ensures that the physics of the grid stay in balance every second of every day.
ERCOT’s core responsibilities break down into three areas: ensuring reliability, maintaining competitive wholesale markets, and facilitating retail operations. Its independent market monitor, Potomac Economics, publishes regular assessments of market performance and competitive conditions — and is one of the better public data sources for anyone trying to understand what’s actually happening in the market.
The three-layer structure most people don’t know about:
When you flip a light switch in Texas, there are actually three distinct types of entities involved, and most people conflate them.
First, there are generators: companies that produce electricity and sell it into the wholesale market. This includes large natural gas plants, wind farms, solar developers, nuclear operators, and increasingly, battery storage facilities.
Second, there are utilities: companies that own and maintain the physical wires that carry electricity from the transmission grid to your neighborhood. In Texas, these are called Transmission and Distribution Utilities, or TDUs. CenterPoint Energy in Houston, Oncor in the Dallas area, AEP Texas in West Texas. When your power goes out after a storm and a crew comes to fix it, that’s the TDU. They charge a regulated “delivery fee” that appears on your electricity bill regardless of who you buy power from.
Third, there are Retail Electric Providers, or REPs. These are the companies you actually choose from when you go to PowerToChoose.org — the state’s official comparison website. Reliant, TXU, Constellation, and hundreds of others. They buy power in the wholesale market and sell it to you with a retail margin built in.
ERCOT sits above all of this. It runs the wholesale market where generators sell and load-serving entities buy. It dispatches generation in real time to keep supply and demand balanced. It manages the interconnection queue for new generators wanting to come online. It coordinates with TDUs on transmission planning.
What this means for you as a consumer: your bill is the product of multiple separate pieces. The commodity cost of electricity, set by wholesale market conditions. The delivery charge, set by the TDU and regulated. And the REP’s margin and any products they’ve structured on top.
Understanding which of those pieces is moving, and why, is the beginning of understanding your exposure to the market.
Part Four: How the Market Actually Works
This section gets technical. But I want to take you through it in plain terms, because once you see the structure, you can’t unsee it.
The four physical constraints that govern every grid:
Any power grid, everywhere in the world, operates under four fundamental physical constraints. These aren’t policies or choices. They’re physics.
The first is instantaneous balance: supply must equal demand in real time. Not yesterday, not in five minutes. Right now. The grid runs at 60 Hz, and any significant deviation from that frequency causes equipment damage and, eventually, cascading failures. This is why grid operators exist — to maintain that balance continuously.
The second is network constraints: power flows across transmission lines according to the laws of electrical impedance, not according to contracts. When too much power tries to flow through a line, you get congestion. Congestion limits what generators can produce and what loads can consume at a given moment.
The third is ramping and commitment limits: generators take time to start up, ramp up, and shut down. You can’t order a gas plant to go from zero to full output in thirty seconds. This means grid operators have to plan ahead, committing resources before they know exactly what demand will be.
The fourth is weather dependence: both load and renewable output are meteorologically determined. A hot afternoon in August means peak demand. A cloudy, windless day means low solar and wind output simultaneously. This creates volatility — and in extreme cases, what statisticians call “fat tails”: low-probability, very high-impact outcomes. Winter Storm Uri in February 2021 was a fat tail event. The grid came closer to total collapse than most Texans know.
The market structure: four layers
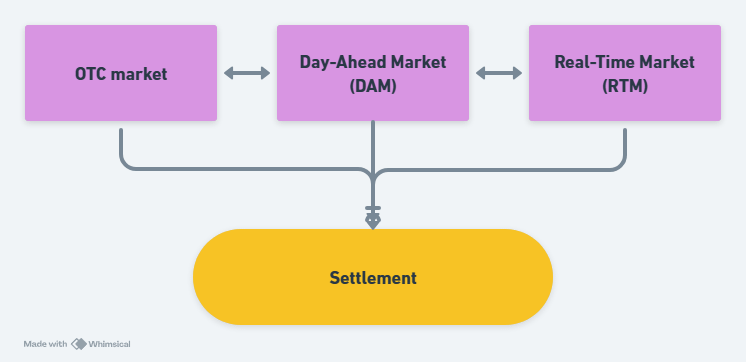
ERCOT’s energy market has three core trading structures plus a settlement layer.
The first is the OTC market: bilateral contracts negotiated outside of ERCOT’s central clearing. Two parties agree on a price and quantity for future delivery. This is where a lot of the longer-term commercial volume happens.
The second is the Day-Ahead Market (DAM): a centrally-cleared auction run by ERCOT for the next operating day. Generators submit offers to sell, loads submit bids to buy, and ERCOT clears a price for each hour of the following day. This is a forward market — participants are committing to produce or consume at prices set today for tomorrow.
The third is the Real-Time Market (RTM): a physical balancing market that runs continuously, settling every five minutes. As actual conditions diverge from the day-ahead schedule — a generator trips, demand surges, wind drops unexpectedly — the RTM adjusts, dispatching units up or down and setting real-time prices.
The fourth layer is settlement: the accounting and payment process that reconciles what was committed in the DAM with what actually happened in the RTM.
Here’s a simple way to think about it: DAM and RTM together constitute the market. Real-time price movement is the liquidity signal. The scarcity adder, which we’ll get to in a moment, is where the volatility lives.
How prices are calculated:
The price of electricity in ERCOT is not one number. It’s a function of location, time, and scarcity.
There are two core pricing mechanisms. The first is the Locational Marginal Price (LMP): the cost of supplying one additional megawatt-hour of electricity at a specific location on the grid. It has three components: the system-wide energy cost, a locational component that reflects congestion and line losses at that specific node, and a scarcity adder.
The second is the Settlement Point Price (SPP): the price used for commercial settlement. ERCOT calculates SPPs for nodes, hubs, and load zones.
Understanding those three reference points matters. A node is a specific physical location on the transmission grid, typically associated with a large generator or major load. A hub is a financial reference point: an aggregated average of node prices in a region, used for hedging and trading. A load zone is an aggregated demand-side reference point that reflects average prices across a geographic area — it’s what most retail contracts are indexed to.
The scarcity adder is where things get interesting. ERCOT uses an Operating Reserve Demand Curve (ORDC) to add value to energy prices when reserve margins are tight. As available reserves fall, the scarcity adder rises, sometimes dramatically. During periods of extreme stress, ERCOT can hit its administrative price cap of $5,000 per MWh. In normal conditions, prices might be $30-50 per MWh. The range is extraordinary.
This is structural volatility, built into the market by design. The logic is that high prices during scarcity should incentivize new generation investment. Whether that signal is working as intended is one of the more contested questions in Texas energy policy right now. S&P Global’s framing is apt: pricing volatility is structural, not temporary. Policy risk must be priced explicitly.
The biggest players:
On the supply side, the most consequential market participants are pivotal suppliers (generators whose output is critical to meeting demand in certain conditions) and generators located in constrained zones (areas of the grid where transmission limits their ability to export power freely).
On the demand side, the most consequential participants are large loads and large flexible loads (LFLs). LFLs are loads that can respond to price signals by curtailing or shifting consumption — crypto mining operations are the most cited example, but industrial facilities and increasingly data centers fall into this category. These are not passive consumers. They participate in the market, and their behavior affects clearing prices.
The QSE (Qualified Scheduling Entity) layer sits between all of this and ERCOT’s central systems. QSEs are the market participants authorized to submit bids and offers to ERCOT, procure and offer ancillary services, and represent supply and demand. If you’re a generator or a large load, you either become a QSE or contract with one. They are the execution layer.
Part Five: Where This Is Going
So here’s where we land.
Texas has a deregulated, islanded, competitive electricity market operating at massive scale. That market is governed by a sophisticated pricing system that rewards efficiency and punishes scarcity. It’s growing, driven by population, industrialization, and now, significantly, by the AI and data center buildout that isn’t slowing down.
The S&P Global framing from their 2026 Global Power Markets Conference is worth keeping in mind as a calibration point for where institutional energy thinking currently sits: demand shock has become a structural shift, grid constraints are the real bottleneck, capital is available but selective — it’s going to bankable projects with reliable offtake, not technology promises. The behind-the-meter revolution is underway, as customers demand control, cost certainty, and resilience. And growth requires coordination across policy, capital, infrastructure, and operations. Technology alone won’t get it done.
None of this resolves cleanly. There are legitimate open questions: whether the scarcity pricing model can attract enough investment to meet the coming demand wave; how reliability standards will evolve as data centers require near-zero downtime; what the regulatory response looks like as ERCOT’s load forecast keeps getting revised upward; and how an average Texas household ends up experiencing all of this in their monthly bill.
Those are the questions worth tracking. That’s what TheGridLetter is here to do.
Energy isn’t a boring utility play. It’s the substrate of the modern economy, and Texas is sitting at the front of a wave that’s still building. The lights are on. The question is what comes next.
Sources and further reading:
ERCOT public market data and reports: ercot.com
Potomac Economics (ERCOT IMM annual state of the market reports): potomaceconomics.com
U.S. Energy Information Administration (EIA), Texas electricity profile: eia.gov
S&P Global Energy, Global Power Markets Conference 2026 (macro themes deck)
PowerToChoose.org (Texas retail electricity comparison, Public Utility Commission of Texas)
Public Utility Commission of Texas: puc.texas.gov