
Here’s what NRG's 20% surge in earnings means for Texas Businesses
The Hidden Secret Behind NRG's Best Quarter in Years Is Scary - Here's what that means for every business buying electricity in Texas.
The largest retail power provider in Texas posted its best Q1 in years, then told investors why the next decade looks even more extreme. Here is what that means for every business buying electricity in Houston.

Table of Contents
Section 01 — The Quarter That Wasn’t Just About Weather
Section 02 — What the Houston Hub Data Actually Shows
Section 03 — The Load That Is Already in the Ground
Section 04 — What Most Commercial Buyers Have Never Been Shown
Section 05 — What NRG Said on May 6th
Section 06 — What Paying Attention Looks Like Before Summer
Summary
NRG Energy’s Texas segment posted $299 million in Adjusted EBITDA in Q1 2025, a 36.5% year-over-year increase, while Houston hub average electricity prices jumped 31.7% in the same period, after two flat years.
The structural driver is a data center load wave already registered in ERCOT’s interconnection queue and confirmed by ERCOT’s own planning forecasts, with data center capacity growing from zero to 24,195 megawatts by 2031 in the adjusted scenario.
By the time you finish reading, you will understand what that structure is, what it costs businesses operating without that knowledge, and what three things to do with the information before summer peaks set next year’s transmission costs.
If you’re new here, start with these:
The Grid Behind the Lights: Understanding ERCOT and Why Texas Energy Is the Market Most People Sleep On: Here
Why Texas Electricity Prices Spike Every Summer (And What It Costs Businesses Who Wait): Here

Section 01
The Quarter That Wasn’t Just About Weather
NRG Energy’s Texas segment generated $299 million in Adjusted EBITDA in the first quarter of 2025. That is up $80 million from the same quarter in 2024, a 36.5% increase in a single year.
For context, NRG’s Texas business is built on the Reliant brand, which has operated more than a million Houston-area commercial and residential accounts since NRG acquired it in 2009. When Texas performs, it is Houston performing as well.
The explanation NRG offered in its SEC filing is as follows:
“higher economic gross margin, including impact of weather, strong plant performance, and supply optimization.”
Weather appears first. It is a real contributor. But a market explanation that begins and ends with weather misses something the data makes plain.

The Houston hub average electricity price was $29.65 per megawatt-hour in Q1 2025, up from $22.52 the prior year.
Two years of essentially flat averages (Q1 2023 at $22.68, Q1 2024 at $22.52) followed by a jump of nearly one-third in a single quarter. A sign that market structure beginning to register a new load reality.
The NRG earnings are where that structure became visible in financial results. The ERCOT data is where it was already visible to anyone watching.
Section 02
What the Houston Hub Data Actually Shows
The average price is the least useful number in the ERCOT market. It is not wrong, it is just incomplete in a way that consistently misleads buyers.
Here is what three years of Houston hub data shows.
In Q1 2023, the average daily price was $22.68 per megawatt-hour. The maximum daily spike that quarter hit $89, nearly four times the average. In Q1 2024, the average slipped slightly to $22.52 while the maximum spike came in at $64, still close to three times the mean. A business watching headline averages through this window saw stability. What the averages did not show was the envelope around them, the range within which prices could move and did, every single quarter.
Then Q1 2025. Average price: $29.65. Maximum spike: $45, or 1.5 times the average.
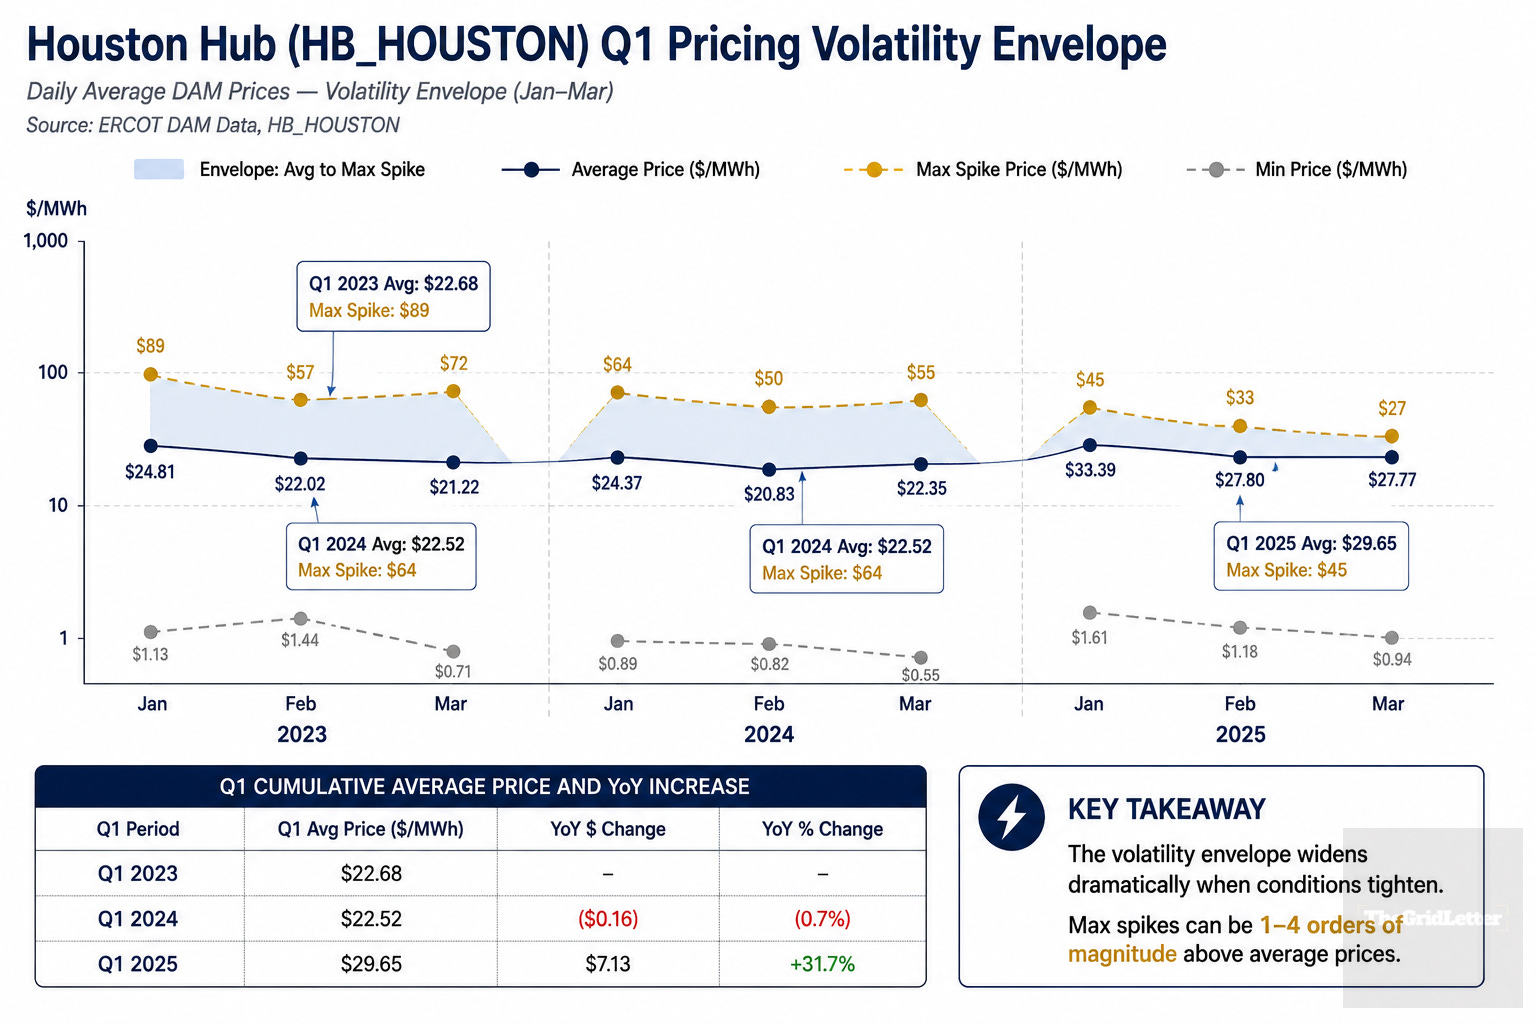
The spike magnitude narrowed in dollar terms while the floor moved sharply upward. For a commercial buyer on a pass-through or indexed contract, both facts matter. For a buyer who renewed into a fixed rate during the 2022–2024 low-average window, the Q1 2025 jump represents the pricing environment they are now walking into at renewal.
That is a different conversation with their supplier than the one they had two years ago. (TheGridLetter inference based on ERCOT DAM price data and standard C&I contract structure. Exposure varies by contract type, term, and load profile.)
The forward picture is more explicit.
An EIA analysis published by Utility Dive in March 2026 modeled ERCOT prices rising 79% under a high data center demand scenario by 2027, compared to a 4% increase under the same scenario in PJM, the largest eastern grid interconnection.
The comparison is the point: PJM has neighboring grids to draw from when demand spikes, plus is a capacity market, unlike ERCOT which is a large ISO energy only market.
This means ERCOT operates as an isolated system, which means localized scarcity events have nowhere to dissipate. The EIA number is a modeled scenario, not a contracted outcome. But no comparable analysis models the condition reversing. (Utility Dive, March 16, 2026, citing EIA analysis.)
Section 03
The Load That Is Already in the Ground
Between December 2024 and November 2025, ERCOT’s large-load interconnection queue grew from 63 gigawatts to 226 gigawatts. A 300% increase in only twelve months. Seventy-three percent of the requests in that queue were from data centers.
In 2025 alone, 225 new large-load requests were filed, more than the entire 2022–2024 period combined. The average project size jumped from 415 megawatts to 725 megawatts, with many now exceeding one gigawatt.
ERCOT VP Kristi Hobbs said publicly in December 2025 that the grid had “outgrown the process.”
The process was built for 40 to 50 large-load requests per cycle. (Utility Dive, January 6, 2026, citing ERCOT board presentation, December 2025.)
Not all of that queue will materialize though of course. ERCOT, Latitude Media, and market analysts have all noted the phantom load problem, speculative requests that inflate the queue without corresponding to real projects.
The article’s argument does not require 226 gigawatts to arrive. It requires enough to strain the grid.
ERCOT’s own Capacity, Demand and Reserves report uses an adjusted forecast that already discounts for attrition. The adjusted scenario shows data center large-load additions growing from essentially zero today to 6,660 megawatts in 2027 and 24,195 megawatts by 2031, the single largest large-load category by 2027.
ERCOT’s adjusted peak demand forecast grows from 85,199 megawatts in 2024 to 154,077 megawatts in 2035.

Those abstract numbers have concrete, public, addresses. Check them out here: Houston Data Centers Map
At 15555 Cutten Rd in Houston’s Cypress Creek corridor, near the former Compaq headquarters, in the middle of an established tech cluster, Serverfarm’s CTX2 campus is in the final months of a twelve-month build.
TDLR permit TABS2025014250.
Filed March 2025. Construction window July 2025 through July 2026. Four hundred thirty-eight thousand square feet. A 60-megawatt AI-ready campus built for rack densities above 50 kilowatts per rack. Structural topping out completed January 2026.
These are named facilities at real addresses commissioning into the Houston hub this summer, Serverfarm is jus one of at least 62 data centers already operating in the Houston metro. More are behind it.

The analogy that fits this moment is the early years of shale production in the Permian Basin. The volumes themselves were not immediately the headline, the infrastructure response to those volumes was. Pipelines and processing capacity took years to catch up with production, and during the lag, pricing diverged in ways that created asymmetric costs for buyers and asymmetric margins for sellers.
The Texas grid is in a similar lag. Load is arriving faster than generation and transmission can absorb it. That gap is where the volatility and risk live.
The reserve margin trajectory confirms it: ERCOT’s CDR projects 17.2% for summer 2026, falling to 9.0% in 2027, and turning negative at -4.4% in 2028. (ERCOT CDR, May 2025 update.) Negative reserve margin does not mean the lights go out, it means the grid has no cushion when the unexpected arrives.
Texas Senate Bill 6, signed in June 2025, addresses the structural problem the article describes: new interconnection requirements, cost-sharing protocols, mandatory curtailment provisions for large loads above 75 megawatts.
Frame it for what it is:
confirmation that the problem is real enough to require legislation. PUCT rulemaking under SB6 extends to December 2026. Commercial buyers are not yet on the other side of it. (Yes Energy, February 2026.)
Want to add to the discussion? Feel free to leave a comment.
Section 04
What Most Commercial Buyers Have Never Been Shown
The Texas electricity market is not opaque by design. It is opaque because it was built for a different era of load and because information does not travel through it symmetrically.
Suppliers track the forward curve as a matter of daily business. Most commercial buyers do not.
The result is a structural gap between what a buyer typically sees when a contract comes up for renewal, a quote from an incumbent supplier and what a full competitive market process produces.
See How Much You Can Save ↓
The incumbent has no incentive to price at the bottom of what they would accept, and the buyer has no reference point unless they generate one by soliciting competing offers against the same load data and the same contract terms.
The gap between a single-source renewal and a multi-supplier competitive process is not always material. In a market where the structural floor has moved up 31.7% in a year, it usually tends to be.
Beyond the commodity price, most commercial buyers in Texas do not have clear line-of-sight into the cost components that sit alongside the energy itself.
Demand charges are determined by your own behavior, not the market average. A single fifteen-minute interval of peak consumption can set a demand level that is billed for the entire month. The charge is on your bill but the mechanism that drives it often is not explained.
4CP transmission costs (the Four Coincident Peaks) are how ERCOT determines each customer’s share of statewide transmission infrastructure costs for the following year. Your load during the four highest demand hours on the ERCOT grid each summer sets your transmission allocation for the next twelve months.
Learn more about 4CP: Why Texas Electricity Prices Spike Every Summer (And What It Costs Businesses Who Wait)
Those hours occur somewhere in the June-through-September window. They are not announced in advance. They are determined by when peak industrial, data center, and weather-driven demand converge on the same afternoon.
Capacity charges are the cost of maintaining reserve generation, the buffer the grid keeps available for peak conditions. These are allocated to load-serving entities and passed through to customers, often embedded in contract pricing without a dedicated line item.
A business that does not know what its 4CP exposure looks like before summer is, as a practical matter, flying without instruments into the window that sets next year’s transmission costs. That is not a failure of the individual buyer. It is a function of what the market makes legible and what requires deliberate effort to find.
Section 05
What NRG Said on May 6th That’s Shocking

Three weeks before this article went to production, NRG held its Q1 2026 earnings call. The Texas segment had a rough quarter by comparison, $216 million in Adjusted EBITDA versus $299 million in Q1 2025.
The reason, per CFO Bruce Chung on the call:
“Houston on-peak prices averaged $29 per megawatt hour, down approximately 13% from last year. Texas experienced the impact of unfavorable weather on our home energy volumes as well as lower average power prices and minimal market volatility.”
Heating degree days were down 30% year-over-year. A mild winter.
The Chung quote continues:
“favorable weather was a big factor in making 1Q 25 a record first quarter for NRG, thereby making the year over year comp for 1Q 26 more challenging.”
That is the structural argument in a single CFO sentence: the Q1 2025 outperformance was real, the Q1 2026 softness is weather, and the base trend is intact. The EBITDA dip and the structural thesis are not in tension. They are the same story told from opposite ends of a weather coin.
Then CEO Robert Gaudette spoke about where the market is heading.
NRG has signed data center retail power agreements targeting front-of-meter pricing at $90 to $95 per megawatt-hour. Behind-the-meter structures imply levelized revenue in the range of $150 per megawatt-hour. (NRG Q1 2026 Earnings Call, May 6, 2026.)
The Houston on-peak average in the same quarter was $29 per megawatt-hour. The spread between $29 and $90 is not the result of one company’s pricing power. It is the result of a grid that cannot easily expand supply to meet the demand curve being priced in those contracts.
Gaudette cited ERCOT’s preliminary long-term load forecast on the call: large-load requests reaching 367 gigawatts by 2033, “more than four times today’s record peak in under a decade.”
He then said:
“even if a fraction of what is in that pipeline arrives on those timelines, this market looks fundamentally different from the one we’re operating in today.”
That is the largest retail energy provider in Texas, on a public earnings call, stating the thesis of this article in plain language.
The 4CP window opens June 1st. It runs through September 30th. NRG’s own guidance for 2026 full-year performance was reaffirmed on that same call. The company has not changed its view of the summer ahead.
Section 06
What Paying Attention Looks Like Before Summer
Three things separate a business that is positioned for this market from one that is not.
Know what you are currently paying, not the blended rate on the bill, but the component breakdown: energy commodity, transmission and distribution, demand charges, and any pass-through costs embedded in the contract.
Most businesses can produce a per-kilowatt-hour number. Fewer can identify what portion of that number is 4CP-sensitive and what it will cost them if this summer’s peaks are anything like Q1 2025.Know when your contract expires. Fixed-rate contracts renewed during the 2022–2024 flat-price window locked in rates when the structural conditions described in this article had not yet registered in market pricing.
Those contracts are coming off. The renewal quotes arriving now reflect the market as it currently exists. Running a competitive quoting process, soliciting prices from multiple suppliers against the same load data and the same contract structure, is what gives you a reference point to evaluate those quotes against. That is not a sophisticated procurement strategy. It is the minimum due diligence in a market where the structural floor moved 31.7% in a single year.Know what your demand exposure looks like before the 4CP window closes. Your load during the four peak hours this summer heavily determines your transmission cost allocation for the following year. That exposure can be audited before the window opens. Once it closes, the number is set.
Most commercial buyers in Texas are not doing all three of these things.
That is not a criticism. The market does not make them easy to do, and the consequences of not doing them tend to appear at renewal rather than in real time.
The businesses paying attention to their 4CP load profile in May and June are operating with information that most of their peers will not have until October (or ever at that), when ERCOT publishes the coincident peak data.
The Texas electricity market is not designed to be easy for buyers. Understanding the structure is the advantage.
TheGridLetter covers what is actually happening in the Texas electricity market; grid conditions, pricing mechanics, procurement strategy, and load growth, one issue per week.
This piece is one of the first in a series on how Texas businesses are navigating the current market.
For those curious about what competitive procurement is read this: [post]
Don’t forget to share!
Sources:
NRG Q1 2025 SEC Form 8-K — https://investors.nrg.com/static-files/e557d982-0a0a-4fc7-af3e-c9fd28e868ab
ERCOT Large-Load Queue (Utility Dive, Jan 2026) — https://www.utilitydive.com/news/ercots-large-load-queue-jumped-almost-300-last-year-official/808820/
Serverfarm CTX2 TDLR Permit — https://www.tdlr.texas.gov/TABS/Search/Project/TABS2025014250
ERCOT CDR Report (Feb 2025) — https://www.ercot.com/news/release/02132025-ercot-releases-capacity
ERCOT Large Load Interconnection Q&A (Dec 2025) — https://www.ercot.com/files/docs/2025/12/24/Large-Load-Interconnection-Process-Q-A.pdf
NRG Q1 2026 Earnings Call Transcript (May 6, 2026) — https://www.sahmcapital.com/news/content/transcript-nrg-energy-q1-2026-earnings-conference-call-2026-05-06
EIA / 79% price hike analysis (Utility Dive, March 2026) — https://www.utilitydive.com/news/data-center-demand-spike-could-drive-79-ercot-price-hike-in-2027/814804/
Houston data centers aggregator — https://www.datacentermap.com/usa/texas/houston/