
Competitive Procurement - Explained
Why the Texas electricity market rewards businesses that compete for their supply, and what it costs those that don't

Within This Issue, We Cover
Section 01 — Why Texas Is a Different Market
Section 02 — What the Forecast Actually Shows
Section 03 — What Competitive Procurement Actually Is
Section 04 — Why Load Size Is an Asset
Section 05 — The Price Signal the Averages Are Hiding
Section 06 — What to Do With This
If you’re new here, start with these:
Competitive Procurement - Official Value Assessment
How AI and Data Centers Are Quietly Reshaping Texas
Section 01
Why Texas Is a Different Market
Texas runs its electricity grid differently from every other state in the country. That sentence gets repeated often enough that it has started to feel like regional pride rather than a functional fact. It is worth being precise about what the difference actually means.
The Electric Reliability Council of Texas, ERCOT, is an independent system operator. It controls approximately 37,000 miles of transmission lines and coordinates the movement of electrons from generation sources to the customers consuming them across one unified market.
Most other states operate through regional transmission organizations that span multiple states and answer to federal jurisdiction. Texas does not. It minimizes its interstate transmission connections deliberately, keeping the vast majority of its grid infrastructure within state lines. The result is that the Federal Energy Regulatory Commission, FERC, has almost no authority over how Texas runs its power market.
The insulation from federal oversight gave Texas the ability to build market structures that other states could not.
It accelerated the adoption of renewable generation by reducing permitting friction. It enabled faster interconnection of new resources. It created a fully competitive wholesale market where thousands of generators, retail electric providers, and large buyers transact in real time. Texas now leads the country in wind generation capacity and is building solar at a pace that is difficult to track quarter to quarter. The market structure made that possible.
What it also created, by design, is a market that rewards participants who understand it and prices those who do not. That asymmetry is not a flaw in the system but instead It is the system working as intended.
Competition requires informed participants on both sides of the transaction. On the supply side, retail electric providers compete aggressively for load. On the demand side, most commercial buyers have never engaged with that competition at all.

Section 02
What the Forecast Actually Shows

In April 2025, ERCOT presented its long-term load forecast to its board of directors.
The numbers in that document are not projections built on optimistic assumptions. They are the result of ERCOT’s own methodology applied to officer-attested load requests submitted by Texas’s transmission and distribution service providers, adjusted downward using actual observed data on how quickly large loads come online.
Even after those adjustments, the picture is striking. Peak demand on the ERCOT grid sat near 94 GW in 2025. The ERCOT adjusted forecast for 2030 shows that figure rising to approximately 138 GW. The TSP-provided forecast, which includes more aggressive assumptions about data center development, puts 2030 peak demand at 218 GW. The two methodologies disagree on magnitude but they do not disagree on direction.
From 2002 to roughly 2022, ERCOT’s load grew on a relatively linear trajectory. New demand came in gradually, generation kept pace, and the system expanded steadily. The post-2024 curve does not continue that trajectory, it inflects.
The growth rate changes character entirely, driven primarily by a single load category: data centers.
In 2025, data center load in Texas accounted for approximately 8 GW of peak demand.
By 2028, that figure is projected to exceed 40 GW, according to a January 2026 report from Bloom Energy cited by the Texas Tribune. Texas is expected to become the largest data center market in the country within two years, surpassing states like Oregon and California that have tighter restrictions on new gas generation. Data center developers are drawn by available land, relatively inexpensive natural gas, and a regulatory environment that does not slow them down.
By 2030, 1 in 5 data centers nationally is expected to exceed 1 GW in maximum energy demand. By 2035, that number is projected to be 1 in 3.
The grid that commercial businesses operate on today is not the grid they will operate on in five years.
The load composition is changing. The demand curve is changing. The supply margin that buffers against price spikes will come under sustained pressure in ways it has not faced before. This is by no means “speculative”, It is in ERCOT’s own forecast documents, adjusted “conservatively”.
Section 03
What Competitive Procurement Actually Is
Most people who have heard the term competitive procurement interpret it as “shopping around for a lower rate”. That is the surface-level version.
In ERCOT, competitive procurement refers to a structured process in which a commercial or industrial customer’s load profile is taken to the supply market and multiple retail electric providers are asked to compete for that business.
Instead of auto-renewing with an existing provider, or accepting a default rate, or calling one supplier and taking whatever they quote, the buyer puts their load out for competitive bids. The supplier who offers the best combination of price, risk structure, and contract terms wins the business.
Use our free savings calculator | See how much you can save
A broker or procurement advisor manages that process, typically at no direct cost to the buyer. The broker’s compensation comes from the supplier side. What the buyer receives is a structured comparison of competing offers across multiple dimensions: price per kilowatt-hour, contract length, pass-through provisions, demand charge exposure, load shape alignment, basis risk, and seasonal pricing exposure. The goal is not just to find the cheapest number. The goal is to engineer the buyer’s exposure to a volatile market.
Arushi Sharma Frank, an energy policy strategist and procurement specialist who helped bring Tesla’s energy business to Texas and now advises Nvidia-backed companies, put it plainly in a recent conversation: “There’s no other market in the country where an industrial customer can curtail or run on-site generation or use demand response assets where they can cut their annual transmission bill by 25 to 40 percent.” (Source: Redefining Energy Podcast, timestamp: here)
On a $100,000 annual electricity bill, a 25 to 40 percent reduction represents $25,000 to $40,000 in annual savings. That number compounds. Here’s a great post that uses storm Uri 2021 as a case study scenario.
It improves operating margins on every dollar of revenue the business generates. And it comes not from a capital investment or an operational change, but from a procurement strategy.
Think of competitive procurement as insurance with a return. You buy insurance to protect yourself against elevated-cost events you cannot predict. You pay a premium for that protection. In competitive procurement, there is no premium.
You are locking in a below-market rate ahead of anticipated price increases, and the protection is the rate itself. The business that signed a well-structured fixed-price contract before Summer 2025 was not paying more for certainty. It was paying less, and getting the certainty as part of the transaction.
The decision variables in a real procurement engagement are more numerous than most buyers realize: price, risk exposure, timing, basis risk, load shape alignment, contract flexibility, pass-through mechanics, seasonal exposure, and demand profile fit.
None of those variables optimize themselves.
Main takeaway:
A buyer going directly to one supplier sees one offer, structured by the supplier, in the supplier’s interest. A buyer running a competitive process sees multiple offers, structured by competition, and evaluated by someone whose job is to find the best fit for the buyer.
Section 04
Why Load Size Is an Asset
The commercial and industrial buyer occupies a different position in this market than a residential customer. The difference reflects a simple economic reality about how supply-side pricing works.
A retail electric provider makes money on the margin between what it pays for wholesale power and what it charges the end customer. A large commercial account consumes more electricity, generates more revenue, and justifies more aggressive pricing to win the business. A residential customer consumes far less individually.
Offering a residential customer a deeply discounted rate would shrink the supplier’s margin without generating the volume to compensate. The math does not work in the buyer’s favor at small scale.
The relationship is direct: larger load equals more attractive counterparty, which equals more competitive pricing. A business with meaningful electricity consumption is offering something the supply side wants. It’s essentially a form of leverage, and most commercial buyers have never used it.
“Pricing knows no limits nor morality”
Suppliers in ERCOT are sophisticated. They price based on load profiles, demand patterns, contract length, and counterparty creditworthiness. A well-structured commercial account with predictable load is exactly the kind of counterparty that brings out competitive pricing.
The supplier who prices aggressively for that account and wins it has made a business decision that works for them.
The buyer who fails to invite that competition has left money in the market.
Section 05
The Price Signal the Averages Are Hiding
Average electricity prices are a useful summary statistic. They are also, in certain conditions, a misleading one.
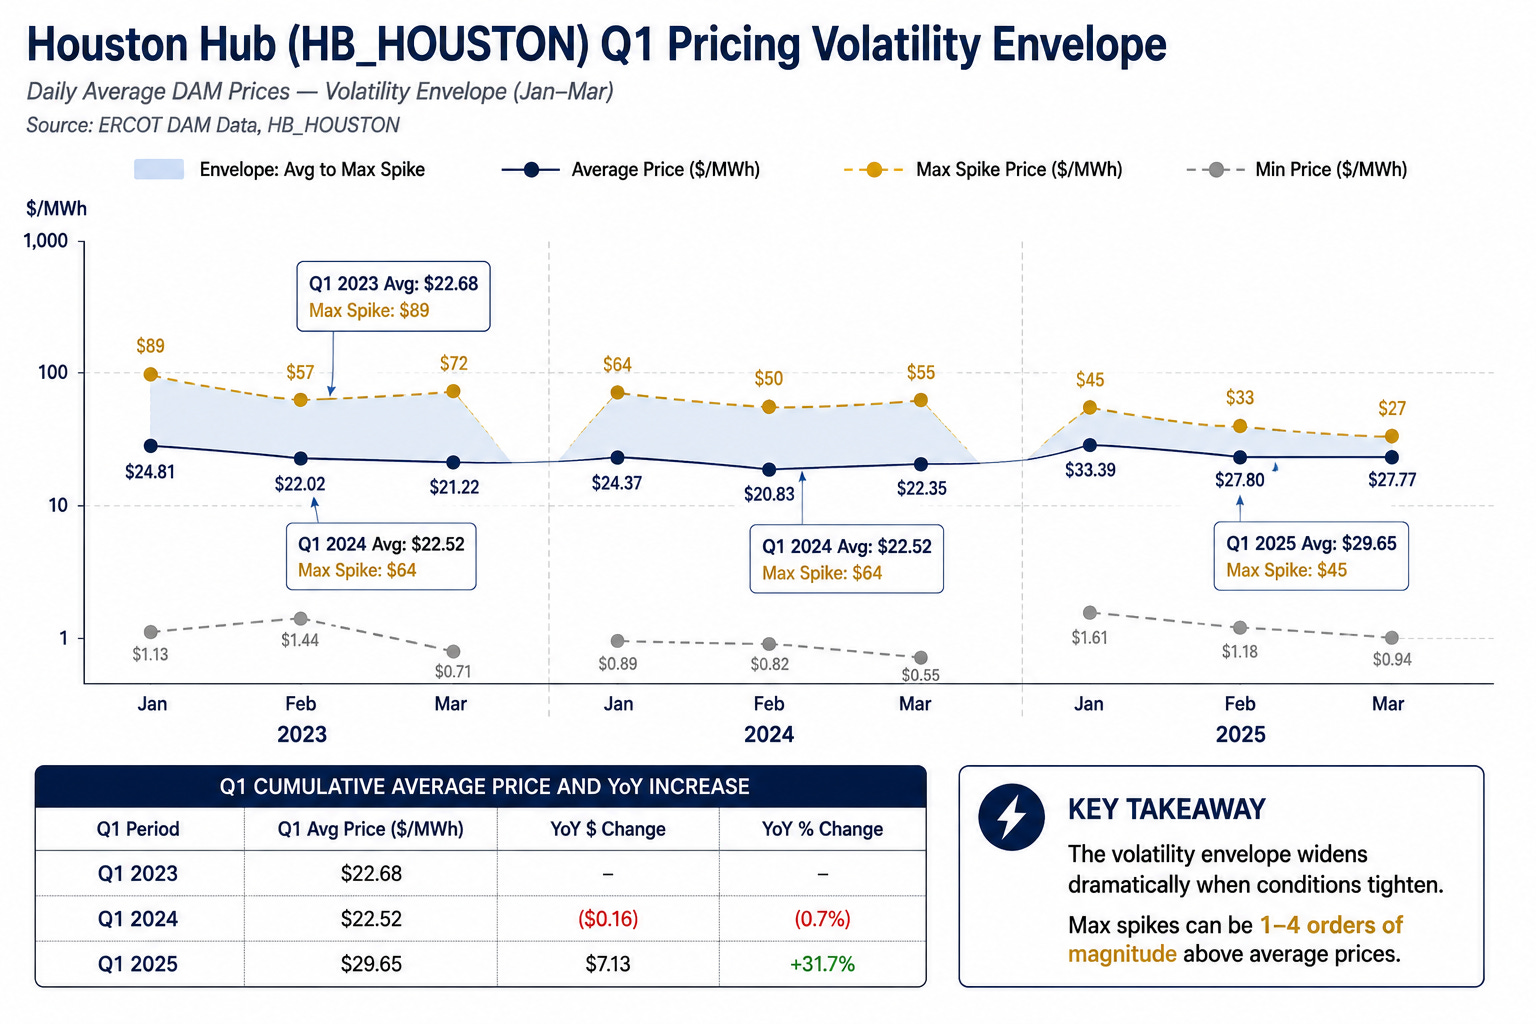
Houston Hub average prices in Q1 2023 and Q1 2024 were essentially flat: $22.68 per megawatt-hour and $22.52 respectively. By Q1 2025, that average had jumped to $29.65, a 31.7 percent year-over-year increase. The trend is clear but the averages do not show the full picture of what buyers are exposed to.
Within any given quarter in the Houston Hub, maximum spike prices are running 1.5 to 4 times the average. That means a business exposed to real-time or index-linked pricing is not paying the average but the volatility hidden in those averages averages.
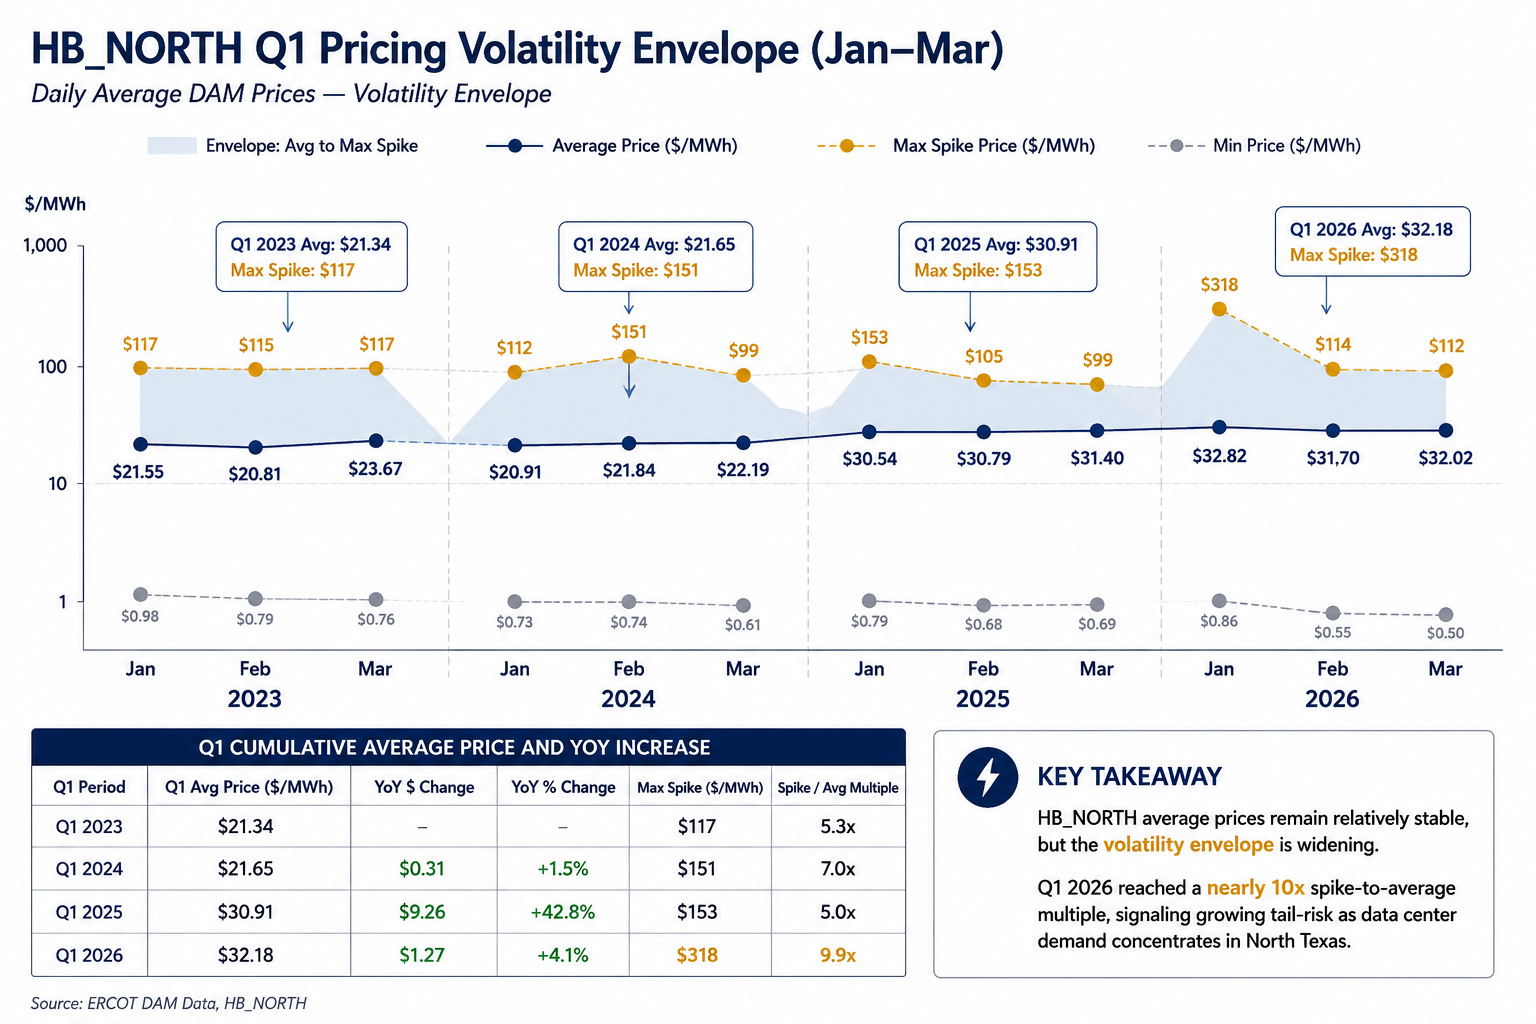
North Texas tells an even sharper story.
Average prices in Q1 2026 were $32.18 per megawatt-hour, only modestly elevated compared to prior quarters. But in January 2026, the maximum spike reached $318.
That is a 9.9 times spike-to-average multiple. A buyer with index exposure in that month paid nearly ten times the average rate during the peak interval.
The explanation for the North Texas pattern is geographic concentration. Data center load is clustering in North Texas.
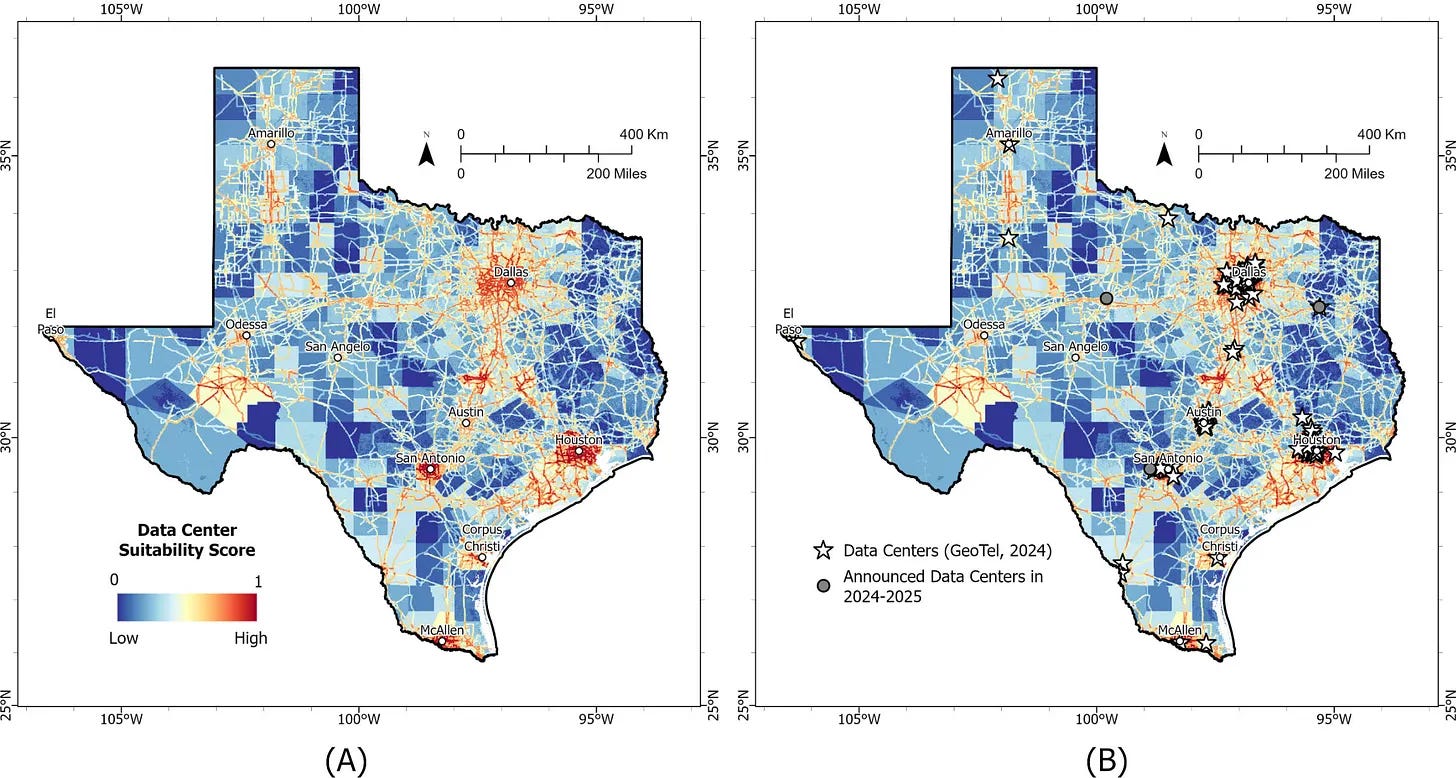
That concentration creates localized transmission constraints. When demand spikes in a geography where supply cannot respond quickly enough, prices spike sharply and briefly. The average stays calm. The tail is violent.
A fixed-rate contract does not eliminate electricity costs, it only eliminates the tail risk.
The buyer on a well-structured fixed contract during January 2026 in North Texas paid their contracted rate. The buyer on an index-linked or pass-through contract experiences a billing event that looked nothing like their average month.
Consider what that looks like in practice. Two businesses. Same geography. Same operational profile. Same energy consumption during that January. The only variable is the contract structure they signed months earlier.
Business A: entered the month on a fixed-price contract, negotiated through a competitive procurement process. Their electricity cost for January was predictable, budgeted, and consistent with prior months.
Business B: The second was on a variable or index-linked rate. Their January bill reflected wholesale conditions during the spike. The same kilowatt-hours that cost one business their contracted amount cost the other business multiples of that, for no operational reason, on no advance notice.
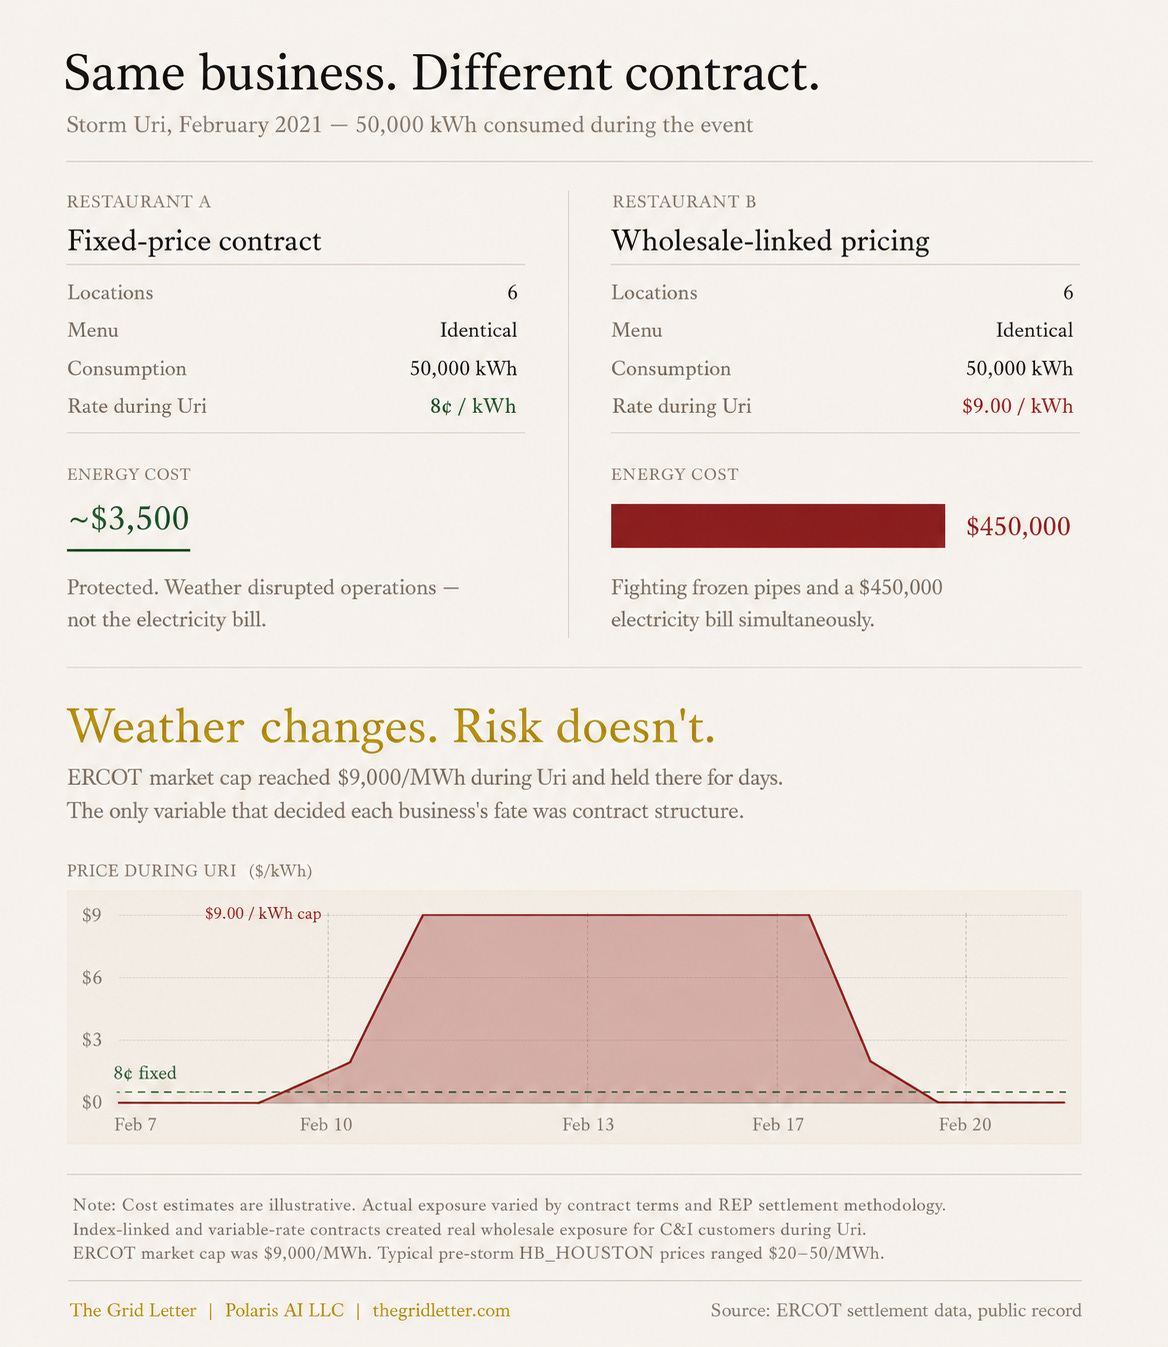
That scenario is a smaller-scale version of what played out during Winter Storm Uri in February 2021.
Wholesale prices hit the ERCOT market cap of $9,000 per megawatt-hour and held there for days. A business consuming 50,000 kilowatt-hours during that period on a normal rate would have expected an energy cost in the range of $4,000.
On wholesale-linked exposure at the market cap, that same consumption represented $450,000 in pricing. The contract structure, signed before any of that was foreseeable, determined the outcome entirely.
Weather changes. Risk doesn’t.
Section 06
What to Do With This
The structural case for competitive procurement in ERCOT is not complicated.
The market is built to reward buyers who compete for their supply.
The forecast shows that demand pressure on this grid will intensify over the remainder of this decade.
The price data shows that volatility is already embedded in the system, episodically and increasingly at the geographic level.
The risk of doing nothing is quantifiable, because the market has already produced events that demonstrate what that risk looks like when it materializes.
Three things are worth knowing about your current situation.
First: what rate structure you are currently on. Fixed, index-linked, variable, or some combination with pass-through provisions. Most business owners do not know the answer without pulling their contract. The structure of that contract determines your exposure to everything described above.
Second: when your current contract expires. Rolling into a new contract at peak summer pricing, or defaulting to a variable rate at the wrong point in the demand cycle, is the most avoidable cost in commercial energy management.
Third: whether your load profile has ever been taken to the market competitively. If it hasn’t, you have not tested whether the supply side will compete for your business. In a market where data center operators, industrial facilities, and large commercial accounts are all actively procuring, the buyers who are not participating in that process are the ones the market prices at will.
The ERCOT market was designed around competition. That competition exists on both sides of the transaction. The question is whether your business is using it.
Ready to find out what the supply market will offer for your load? Polaris works with Texas businesses to run a structured, competitive procurement process at no cost to the buyer.
Sources:
ERCOT. Long-Term Load Forecast Update (2025–2031) and Methodology Changes. Board of Directors Meeting, April 7–8, 2025. ercot.com
Cobler, Paul. “Texas forecast to be top market for data centers in two years, increasing grid demand.” Texas Tribune, January 20, 2026. texastribune.org
Sharma Frank, Arushi. Energy policy strategist, grid systems expert, and procurement specialist. Podcast interview referenced at 6:10 mark.